A NEER public-good project
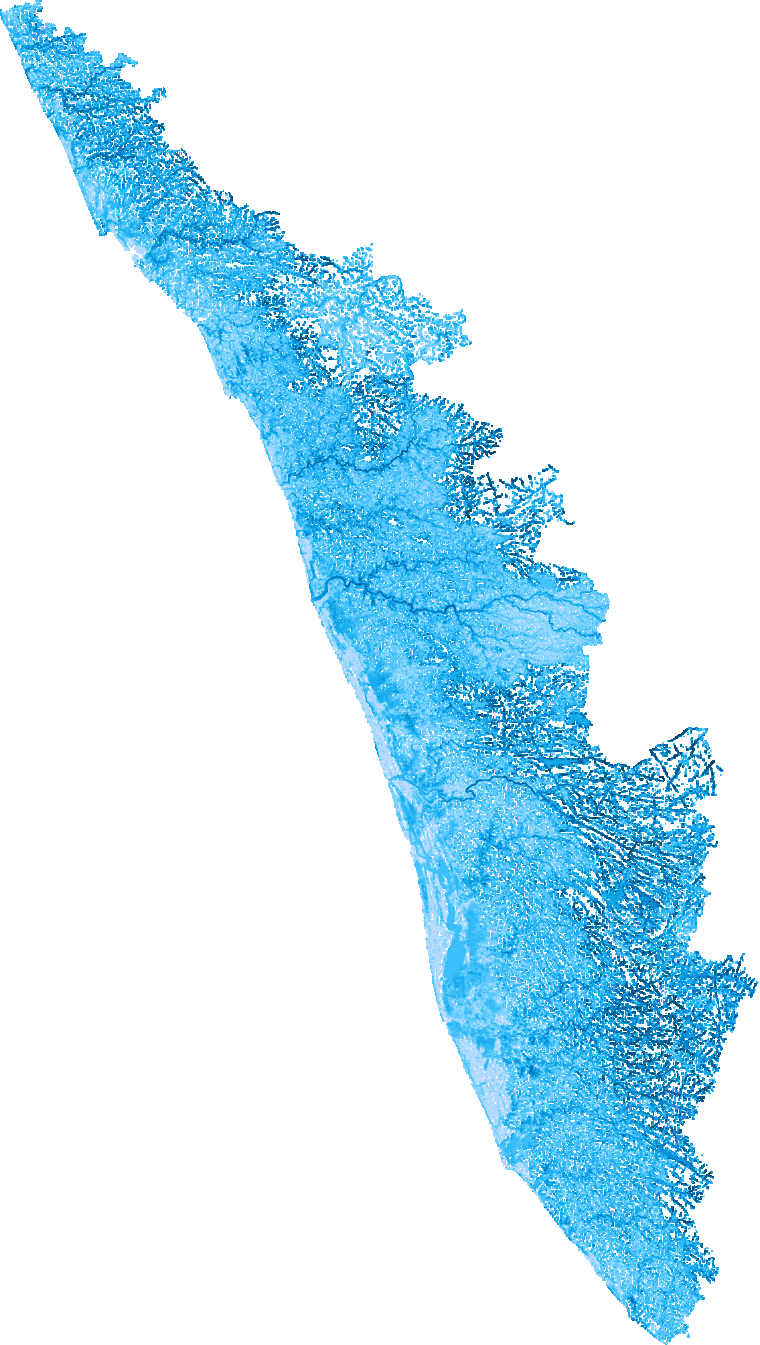
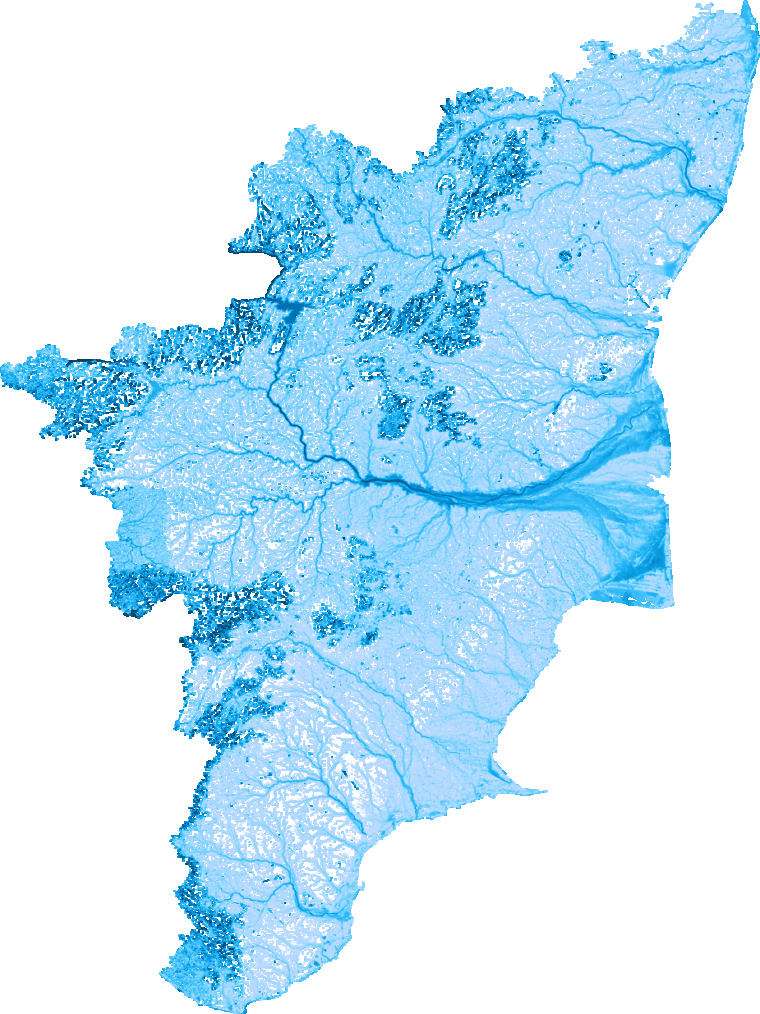
The first statewide, publicly accessible 1% annual-chance (100-year) flood hazard maps for India β starting with Tamil Nadu and Kerala. Free, transparent, and honest about what it can and can't tell you.
Tamil Nadu Β· 100-yr flood depth
Why this exists
Hundreds of millions of people in India live with flood risk they can't see. The best flood data is either commercial and closed, or built for other countries. We're changing that β openly.
No paywall, no login. Anyone can explore the full flood map β and read exactly how it was made.
Every step is documented and built on open, well-sourced data. Not a black box.
Modeled on Indiaβs own terrain and monsoon rainfall, state by state β not adapted from another country.
The idea everyone gets wrong
It means a 1% chance every single year β and the risk stacks up the longer you stay. Try it:
β¦the chance of seeing at least one 100-year flood is about 1 in 4.
βIt flooded last year, so we're safe for decades.β The odds reset every January 1st β last year's flood changes nothing about this year's 1%.
Over a 30-year home loan, it's roughly a 1-in-4 chance. Over a lifetime in one place, higher still. That's why a 1% map matters.
The human stakes
building footprints sit where a 100-year flood would reach β about 16% of the 39M buildings mapped across three regions home to ~114 million people.
Each square β 2% of mapped buildings. Modeled estimate β building footprints overlaid on the 100-year flood layer.
Of the 6.3M exposed footprints, by modeled flood depth:
Mean depth where flooded: 1.1 m. Most exposure is shallow β but even shallow urban flooding shuts a city down.
Share of each district's buildings inside the 100-year floodplain. The Cauvery delta and Kerala's backwaters stand apart.
The severe (> 3 m) tail concentrates in Kerala's hill-edge districts (Idukki, Pathanamthitta, Kannur) β partly genuine steep-valley flooding, partly where the DEM is weakest. We flag it rather than hide it.
How it's built
A fully documented pipeline. Click a stage to see what happens inside.
Stage 1
The NEER DEM is a bare-earth terrain model built for hydrology across India. We derive it from GEDTM30 (CC-BY, OpenGeoHub) and calibrate it against ICESat-2 ATL08 ground photons β NASA laser measurements of the true ground surface. A spatially-blocked, cross-validated bias surface removes systematic error, and a LightGBM residual model corrects what remains. Heights are referenced to the EGM2008 geoid and hydro-flattened (sea β 0, inland water β bank level) so water routes correctly through the model.
Stage 2
The SCS Curve Number method translates design rainfall into surface runoff based on land cover and soil, setting how much water reaches the channels and floodplain.
Stage 3
Statistical frequency analysis of rainfall records yields the 1% annual-chance design rainfall β the event that defines this flood layer.
Stage 4
We route the design event through a 2D HEC-RAS hydraulic model over the NEER DEM to produce modeled flood depth in meters across the floodplain.
Accuracy & limitations
National terrain error (MAE), before β after correction
Systematic bias, driven to near-zero nationwide
In the atlas states the NEER DEM is at its strongest. Tamil Nadu lands at 1.04 m and Kerala at 1.65 m mean absolute error against ICESat-2, at near-zero bias β flat, flood-relevant terrain, which is exactly where terrain accuracy matters most for modeled flood depth. Accuracy is lower in steep, mountainous regions, where even the satellite ground-truth is itself noisy.
Coverage & roadmap
Hover a state to highlight it; click a live state to open its map. The data is published on a schema built to grow β every new state and return period drops straight in.
Only the 100-year (1%) event is free today. The others β and full property-level risk β are available from NEER on request.
Request other return periods βFree to explore. No login. Opens the live interactive map.
Need other return periods (2-yr to 1000-yr) or full property-level risk? Contact NEER β
Questions
It means a flood of this size has a 1% chance of happening in any given year β every year. It is NOT βonce every 100 years.β Over a 30-year mortgage, the chance of seeing at least one such flood is about 26%. The name is a probability, not a schedule.
No. It is an open, independent, modeled flood hazard atlas built by NEER for public awareness and planning context. Always defer to official local authorities for regulatory or emergency decisions.
The underlying NEER DEM reaches sub-meter to ~1.6 m accuracy in the atlas states (Tamil Nadu 1.04 m, Kerala 1.65 m corrected MAE vs ICESat-2), at near-zero bias. The flood layer is modeled on top of that at ~30 m, so treat it as regional hazard screening rather than parcel-level truth.
Yes β it is free and public. The methodology and source data are documented and openly licensed (see attributions). Get in touch if you want to collaborate or need the underlying data.
Free today: Tamil Nadu and Kerala, 100-year (1% annual chance) only. Other return periods β 2, 5, 10, 25, 50, 500 and 1000-year β and full property-level risk are available from NEER on request. More states are being added on the same open schema.