A NEER public-good project

India's flood risk,
finally made open.

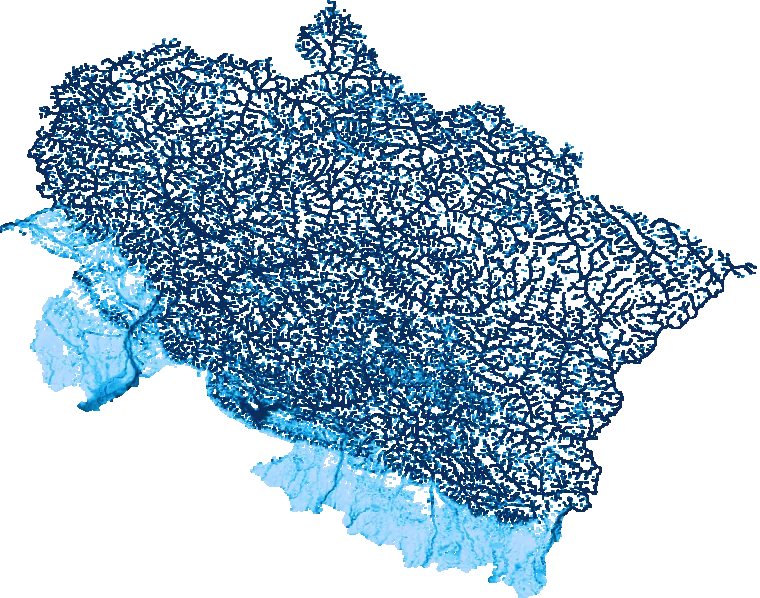
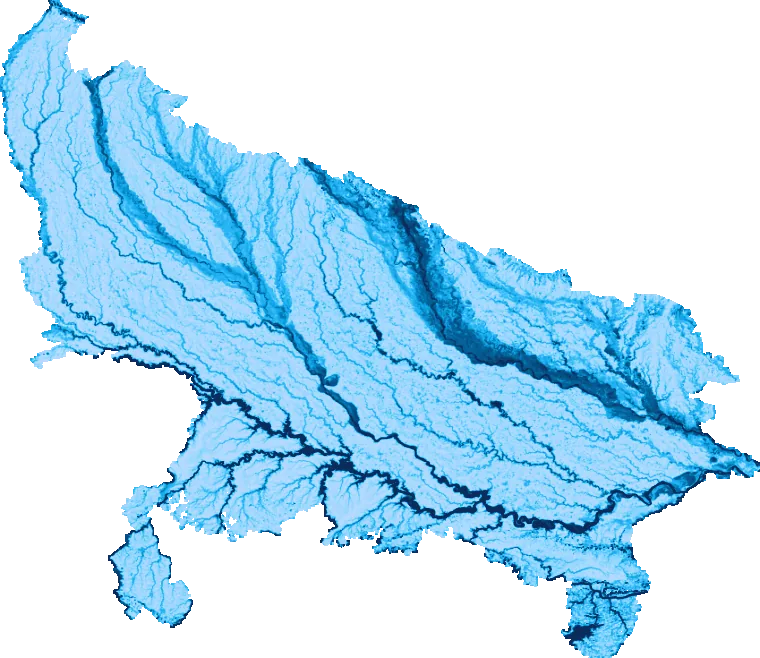
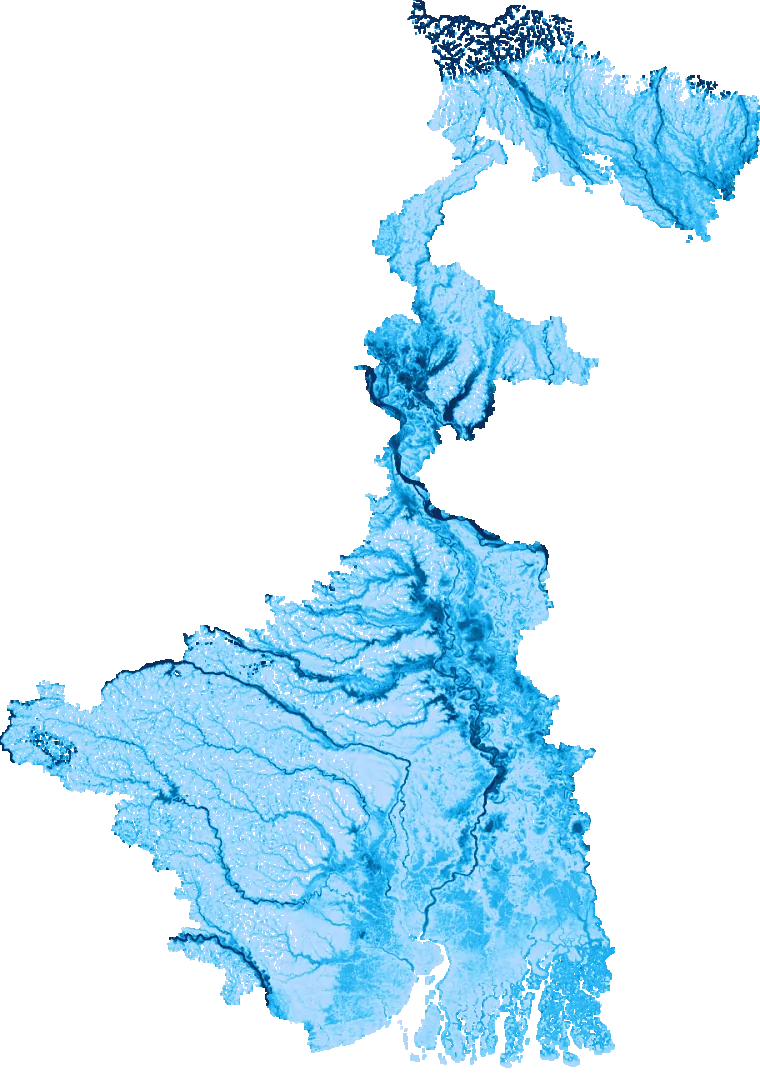
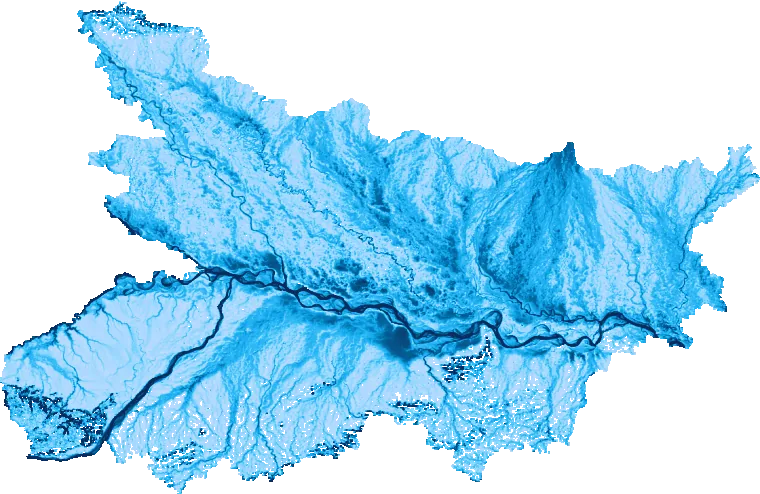
The first statewide, publicly accessible 1% annual-chance (100-year) flood hazard maps for India — now spanning all 36 states and union territories, from the Himalaya to the Northeast to the islands. Free, transparent, and honest about what it can and can't tell you.

0
Buildings in the floodplain
0
states & union territories
0
Grid resolution
0
Free & open
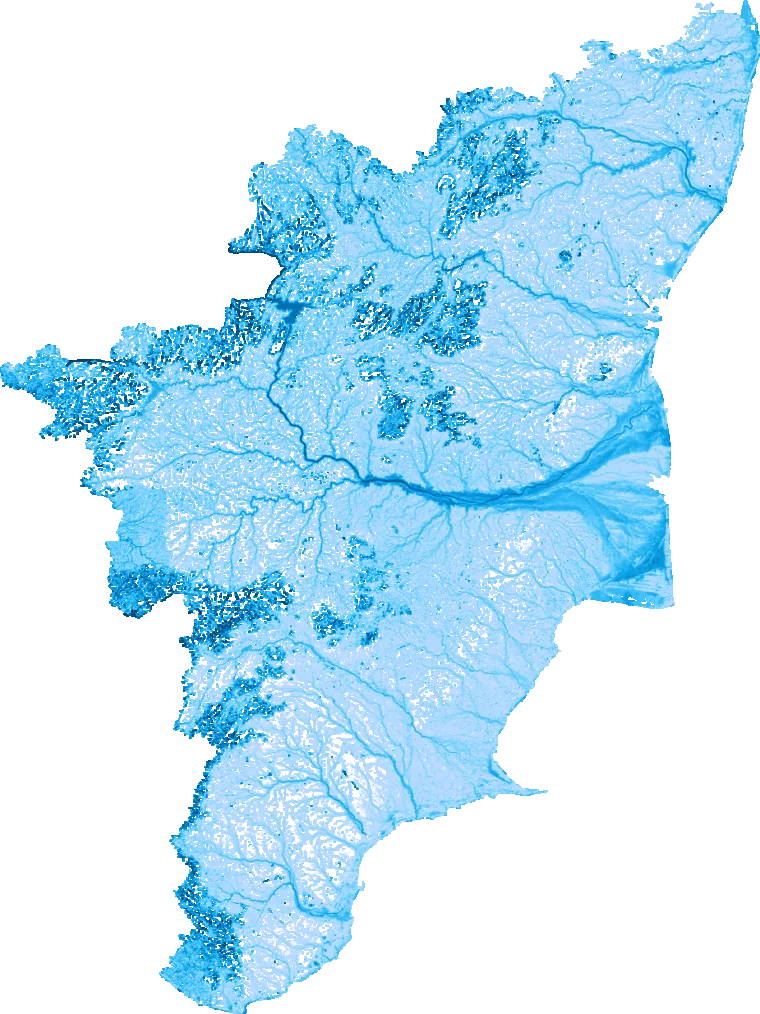
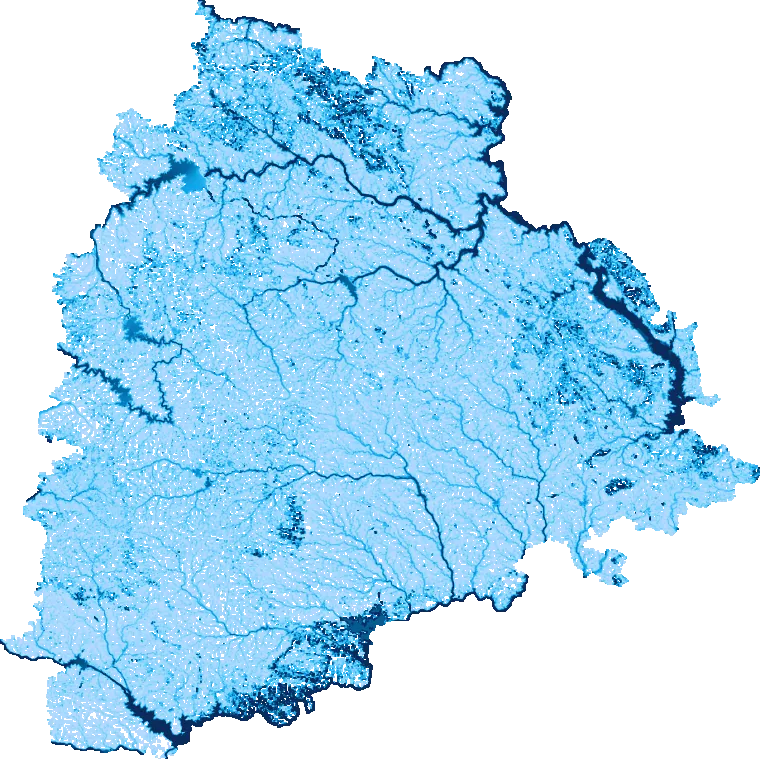
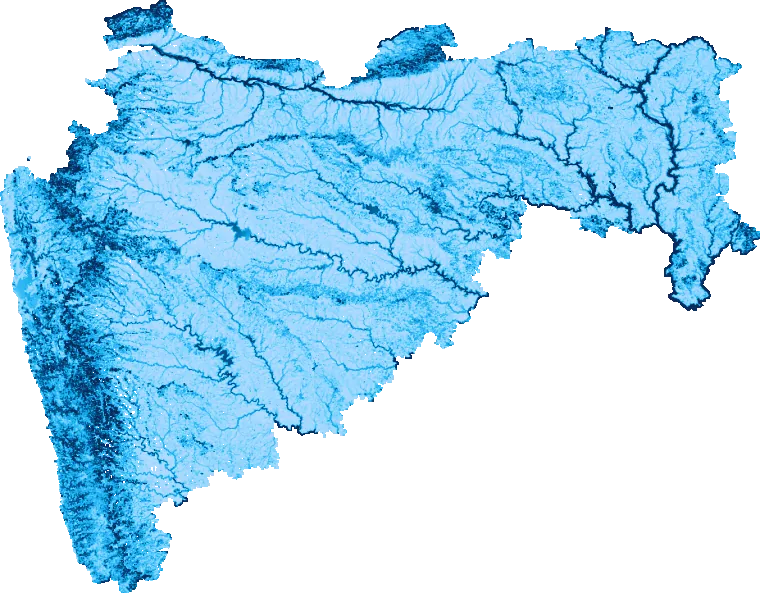
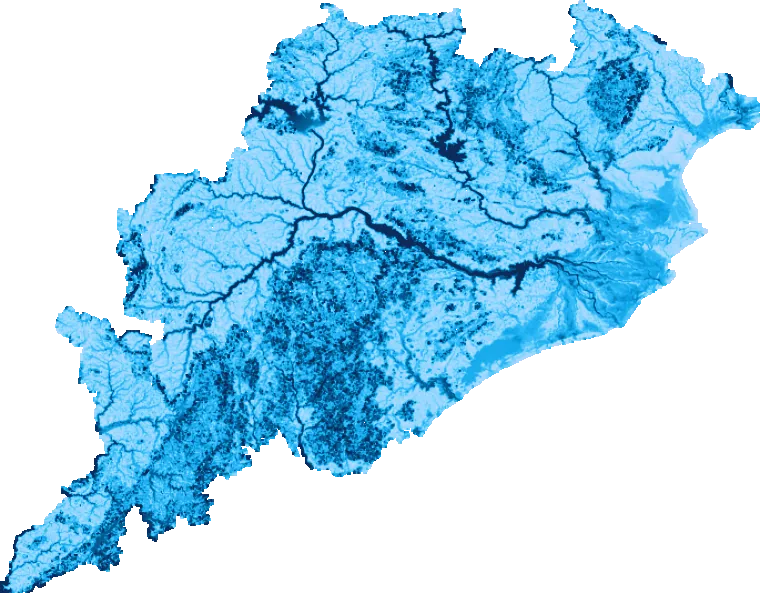
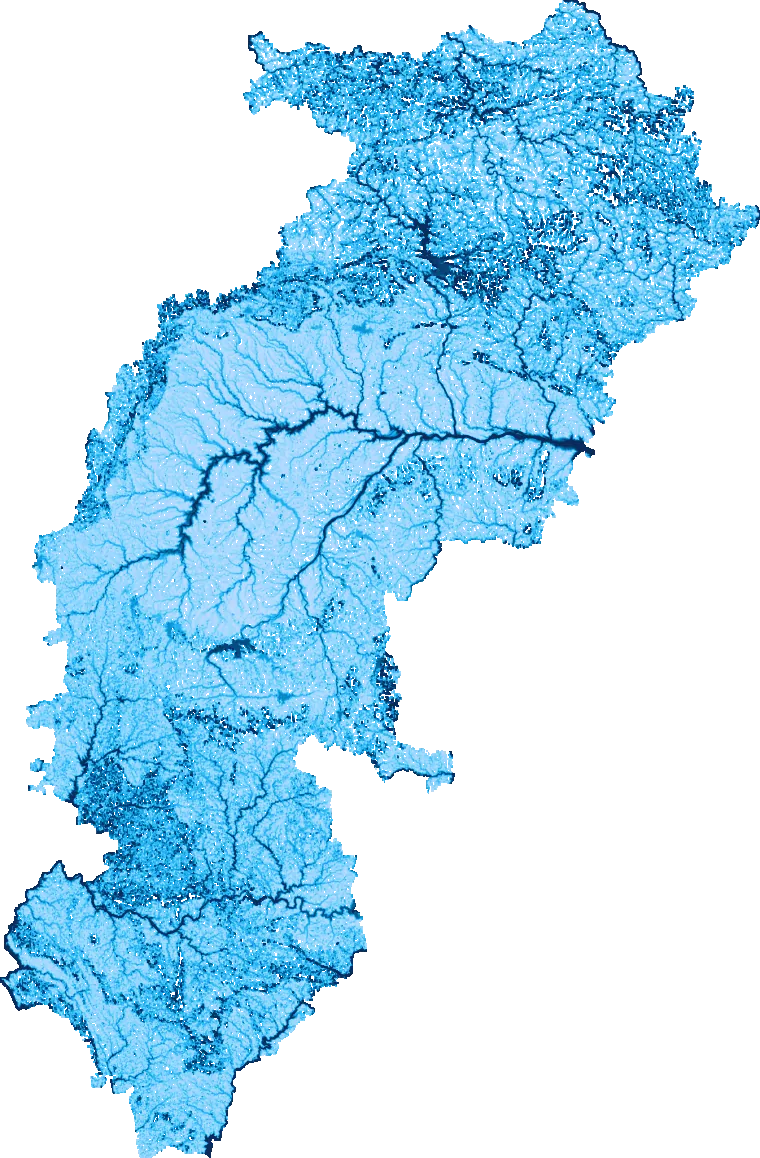
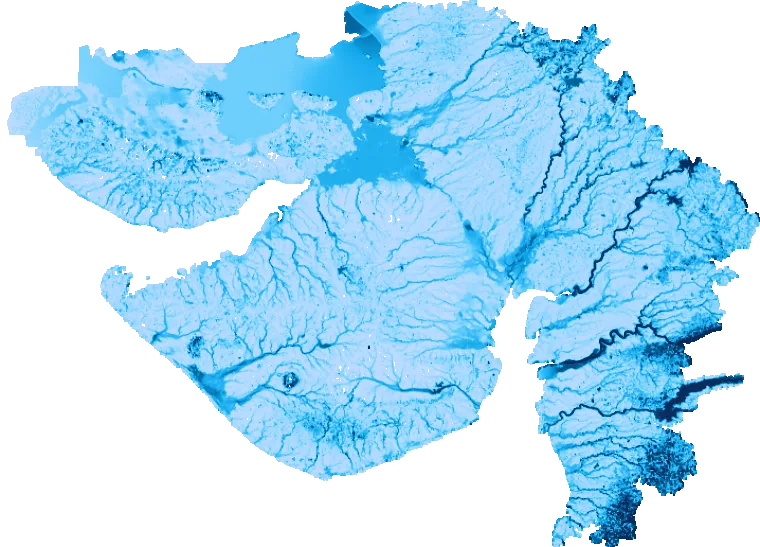
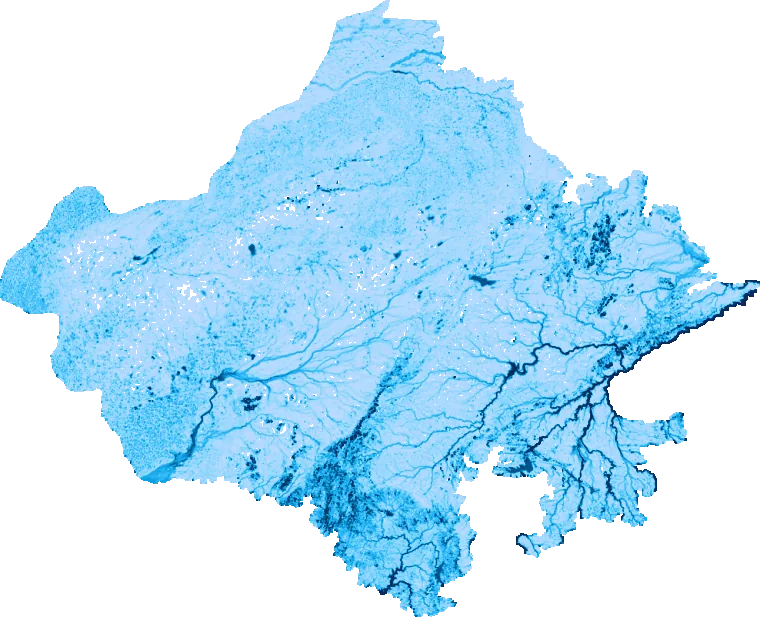
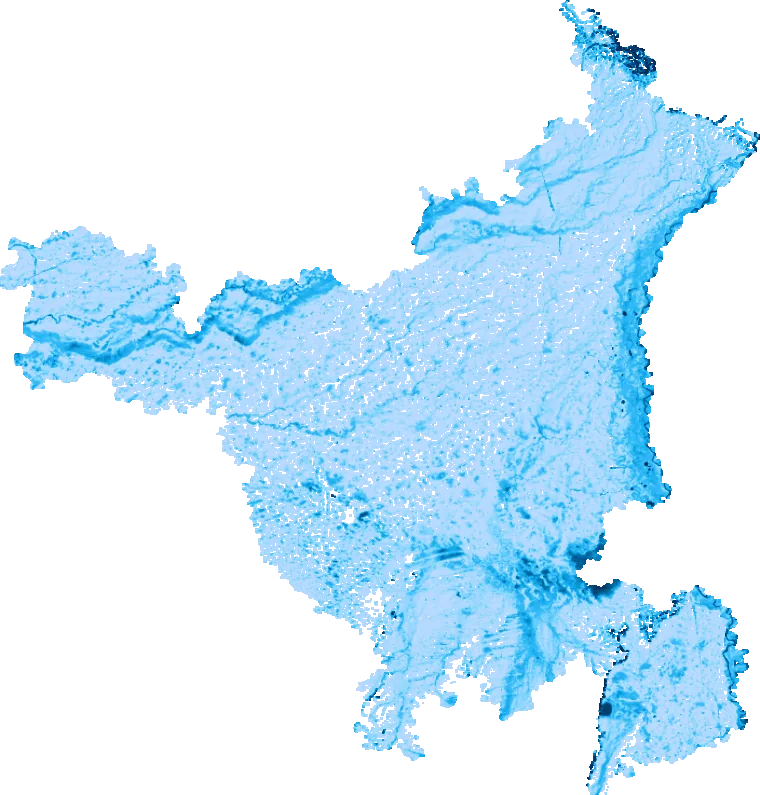
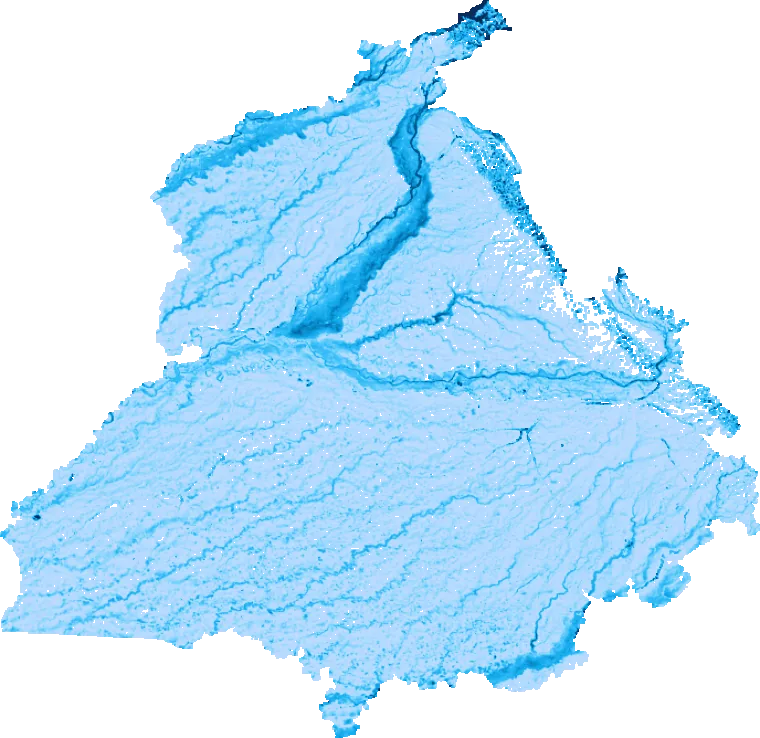
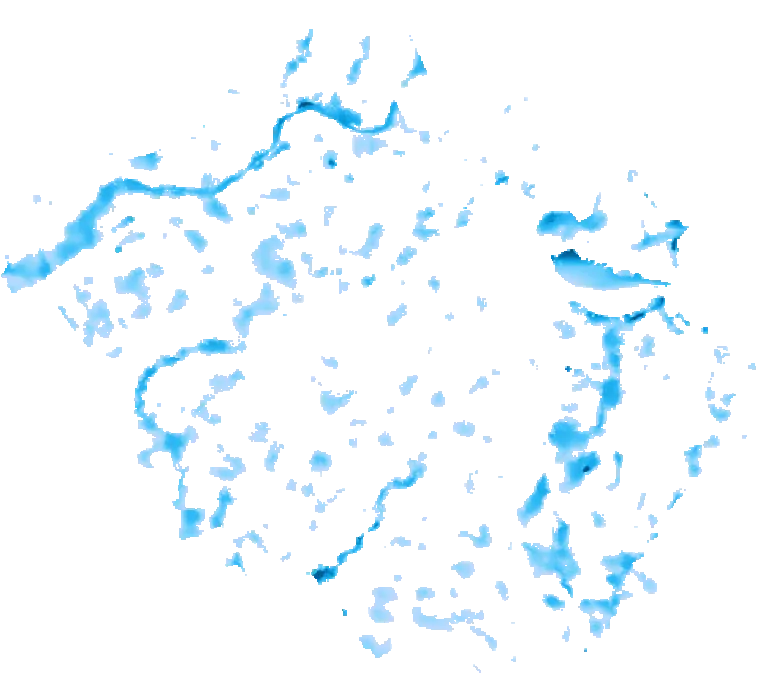
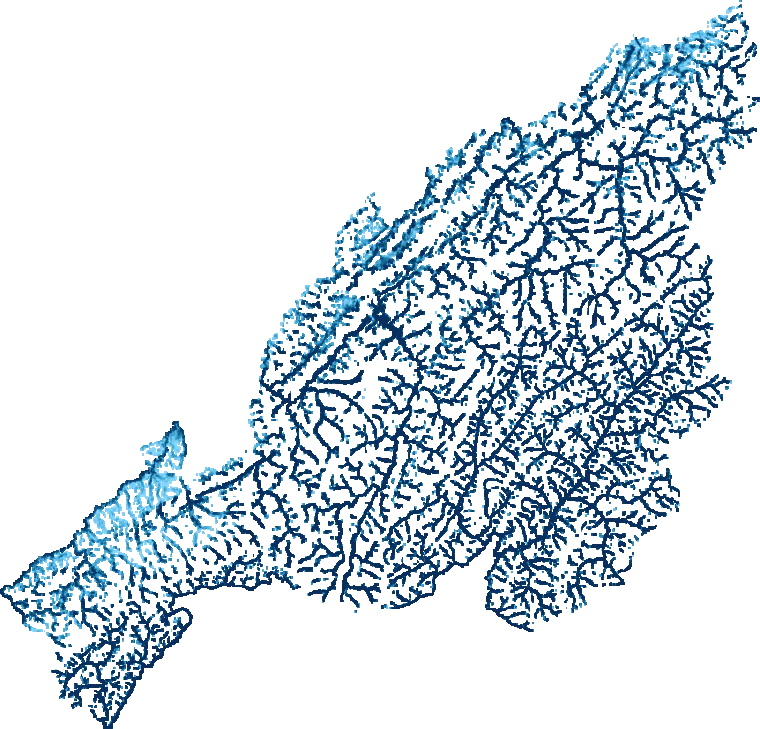
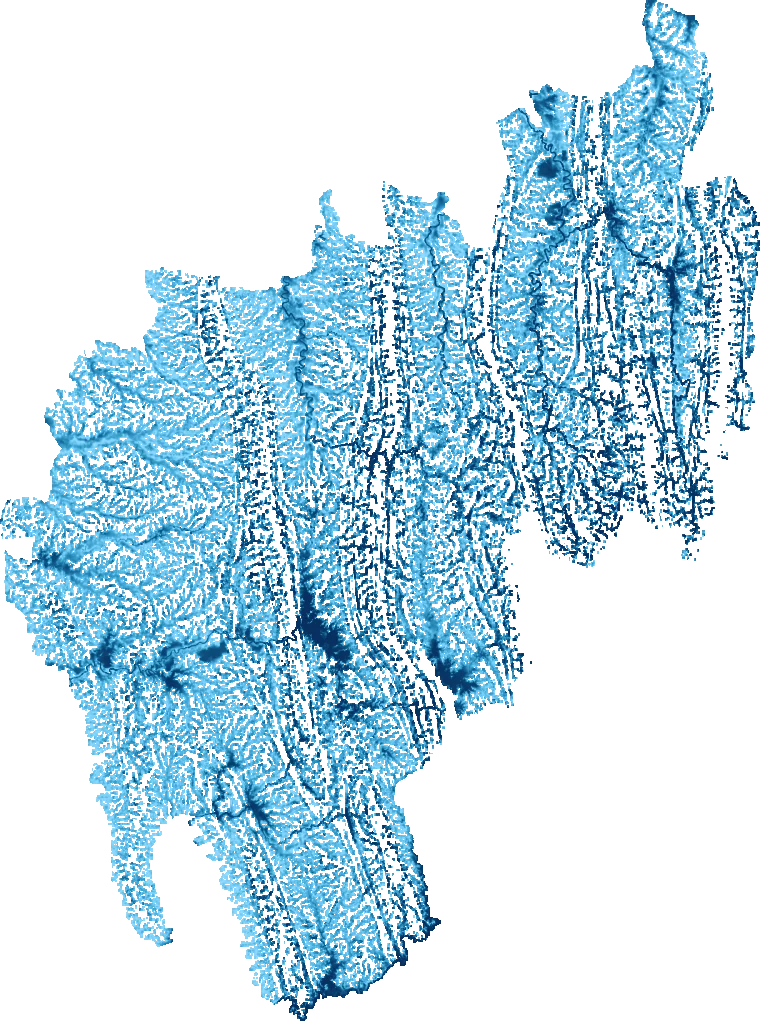
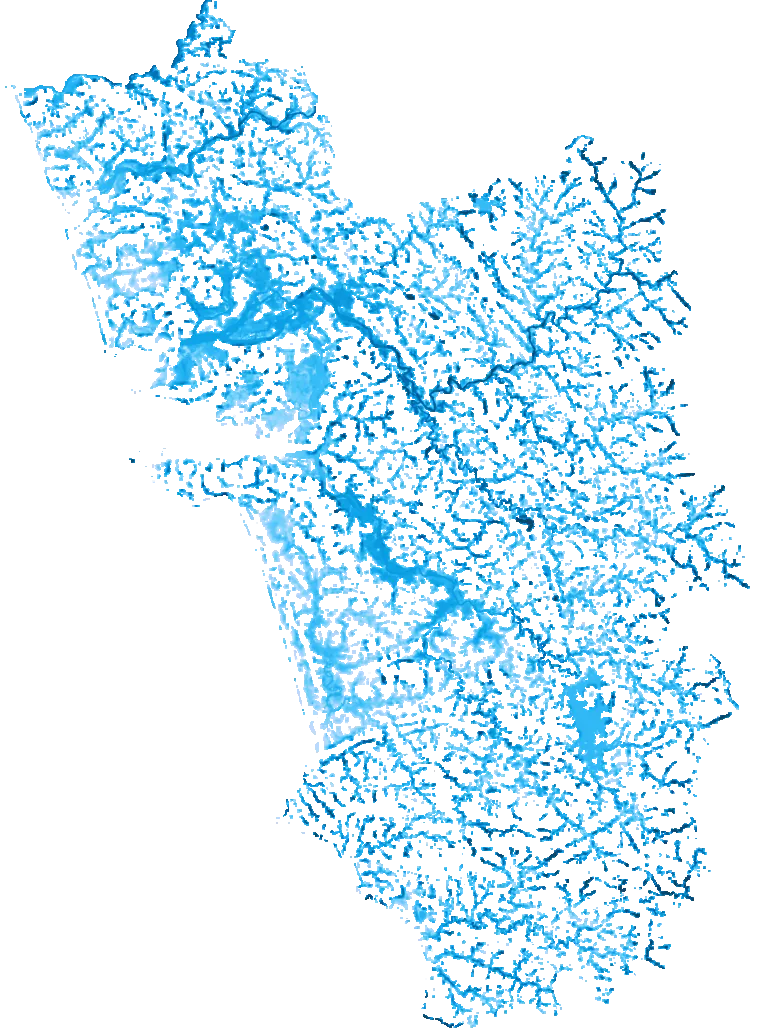
Modeled 100-year flood depth across Tamil Nadu & Puducherry Tamil Nadu & Puducherry · 100-yr flood depth
Shallow Deep

Why this exists

Good flood maps exist. Just not for the people who need them.

Hundreds of millions of people in India live with flood risk they can't see. The best flood data is either commercial and closed, or built for other countries. We're changing that — openly.

01

Free & open

No paywall, no login. Anyone can explore the full flood map — and read exactly how it was made.

02

Transparent

Every step is documented and built on open, well-sourced data. Not a black box.

03

Built for India

Modeled on India’s own terrain and monsoon rainfall, state by state — not adapted from another country.

The idea everyone gets wrong

A “100-year flood” is not once every 100 years.

It means a 1% chance every single year — and the risk stacks up the longer you stay. Try it:

30 years

…the chance of seeing at least one 100-year flood is about 1 in 4.

26%
The myth

“It flooded last year, so we're safe for decades.” The odds reset every January 1st — last year's flood changes nothing about this year's 1%.

The reality

Over a 30-year home loan, it's roughly a 1-in-4 chance. Over a lifetime in one place, higher still. That's why a 1% map matters.

The human stakes

Across all 36 states & union territories, the 1% floodplain isn't empty.

0

building footprints sit where a 100-year flood would reach — about 21% of the 383M buildings mapped across 36 states & union territories — home to ~1.39 billion people.

Each square ≈ 2% of mapped buildings. Modeled estimate — building footprints overlaid on the 100-year flood layer.

How deep, for how many buildings

Of the 79M exposed footprints, by modeled flood depth:

  • 0–0.5 m 43% 33.93M
  • 0.5–1 m 23% 17.92M
  • 1–2 m 21% 16.50M
  • 2–3 m 8% 5.97M
  • 3–6 m 5% 3.60M
  • > 6 m 2% 1.47M

Mean depth where flooded: 1.2 m. Most exposure is shallow — but even shallow urban flooding shuts a city down.

The roads and railways that flood with them

Roads
14%

of the road network — 11,81,793 km — floods in a 100-year event.

Railways
17%

of railway track — 42,354 km — floods in a 100-year event.

A transport segment counts as at risk when the modeled flood is ≥ 15 cm (6 in) deep — enough to stall vehicles and trains.

Where the risk concentrates — by district

Share of each district's buildings inside the 100-year floodplain. Assam's Brahmaputra valley now leads the atlas — Majuli and South Salmara Mankachar approach nine buildings in ten — ahead of the Kosi belt in Bihar, the Krishna–Godavari delta and the Cauvery delta.

  1. 0 South Salmara MankacharAS 90% 168K
  2. 0 MajuliAS 89% 58K
  3. 0 SupaulBR 84% 743K
  4. 0 BarpetaAS 81% 537K
  5. 0 DhubriAS 79% 408K
  6. 0 MadhepuraBR 75% 587K
  7. 0 JiribamMN 72% 14K
  8. 0 MorigaonAS 72% 244K
  9. 0 SaharsaBR 71% 393K
  10. 0 NagaonAS 63% 414K
  11. 0 Cooch BeharWB 63% 728K
  12. 0 BegusaraiBR 63% 405K
  13. 0 JhajjarHR 61% 220K
  14. 0 DarbhangaBR 60% 544K
  15. 0 RampurUP 59% 280K
  16. 0 KapurthalaPB 59% 159K
  17. 0 BahraichUP 57% 673K
  18. 0 AmritsarPB 56% 350K
  19. 0 LakhisaraiBR 56% 128K
  20. 0 PatnaBR 56% 675K
  21. 0 BastiUP 55% 395K
  22. 0 KhagariaBR 55% 223K
  23. 0 KamrupAS 55% 450K
  24. 0 South 24 ParganasWB 54% 1.35M
  25. 0 LakhimpurAS 53% 262K
  26. 0 Upper SubansiriAR 53% 16K
  27. 0 Purba MedinipurWB 53% 843K
  28. 0 BandiporaJK 53% 77K
  29. 0 Kamrup MetropolitanAS 52% 221K
  30. 0 PanipatHR 51% 134K
  31. 0 CacharAS 51% 254K
  32. 0 SitamarhiBR 50% 400K
  33. 0 MoradabadUP 49% 293K
  34. 0 GondaUP 48% 508K
  35. 0 BongaigaonAS 48% 148K
  36. 0 GhaziabadUP 48% 229K
  37. 0 BalliaUP 48% 456K
  38. 0 Sant Kabir NagarUP 47% 212K
  39. 0 MayiladuthuraiTN 47% 155K
  40. 0 KatiharBR 47% 516K
  41. 0 DarrangAS 47% 203K
  42. 0 KaraikalPY 46% 19K
  43. 0 JagatsinghpurOD 46% 156K
  44. 0 SambhalUP 46% 265K
  45. 0 SirsaHR 46% 260K
  46. 0 Gautam Buddha NagarUP 46% 255K
  47. 0 GorakhpurUP 46% 472K
  48. 0 SonipatHR 46% 207K
  49. 0 DelhiDL 45% 537K
  50. 0 RewariHR 45% 170K
  51. 0 GoalparaAS 45% 201K
  52. 0 Tarn TaranPB 45% 201K
  53. 0 AmrohaUP 45% 211K
  54. 0 KarnalHR 45% 186K
  55. 0 Lakhimpur KheriUP 44% 576K
  56. 0 SrinagarJK 44% 74K
  57. 0 VaranasiUP 44% 380K
  58. 0 RohtakHR 44% 145K
  59. 0 SaranBR 43% 418K
  60. 0 NalandaBR 43% 301K
  61. 0 VadodaraGJ 43% 262K
  62. 0 PolavaramAP 43% 63K
  63. 0 CharaideoAS 43% 79K
  64. 0 FatehabadHR 42% 158K
  65. 0 NalbariAS 42% 149K
  66. 0 North 24 ParganasWB 42% 941K
  67. 0 AhmedabadGJ 42% 409K
  68. 0 PurniaBR 41% 510K
  69. 0 NagapattinamTN 41% 118K
  70. 0 HisarHR 41% 265K
  71. 0 Charkhi DadriHR 41% 93K
  72. 0 ArariaBR 41% 416K
  73. 0 HailakandiAS 39% 82K
  74. 0 KrishnaAP 39% 240K
  75. 0 ChandauliUP 38% 226K
  76. 0 FerozepurPB 38% 135K
  77. 0 GhazipurUP 38% 446K
  78. 0 HowrahWB 38% 415K
  79. 0 KaimurBR 38% 176K
  80. 0 NadiaWB 38% 634K
  81. 0 ShamliUP 37% 114K
  82. 0 KurukshetraHR 37% 112K
  83. 0 NamsaiAR 37% 22K
  84. 0 GurdaspurPB 37% 198K
  85. 0 BuxarBR 37% 156K
  86. 0 SheikhpuraBR 37% 58K
  87. 0 ThiruvarurTN 37% 184K
  88. 0 BharatpurRJ 37% 308K
  89. 0 MeerutUP 37% 258K
  90. 0 MaldaWB 37% 421K
  91. 0 East KamengAR 36% 9K
  92. 0 DibrugarhAS 36% 196K
  93. 0 FazilkaPB 36% 145K
  94. 0 VaishaliBR 36% 341K
  95. 0 AmbalaHR 36% 108K
  96. 0 AlipurduarWB 36% 193K
  97. 0 JehanabadBR 36% 110K
  98. 0 KokrajharAS 36% 173K
  99. 0 BareillyUP 35% 361K
  100. 0 PatialaPB 35% 215K
  101. 0 AnandGJ 35% 200K
  102. 0 Imphal EastMN 35% 58K
  103. 0 Shi YomiAR 35% 3K
  104. 0 DeoriaUP 35% 265K
  105. 0 North and Middle AndamanAN 35% 17K
  106. 0 KhedaGJ 34% 199K
  107. 0 KarimganjAS 34% 109K
  108. 0 KendraparaOD 34% 134K
  109. 0 KaithalHR 34% 113K
  110. 0 SivasagarAS 34% 97K
  111. 0 CuttackOD 33% 262K
  112. 0 GandhinagarGJ 33% 147K
  113. 0 HanumangarhRJ 33% 306K
  114. 0 West KamengAR 33% 15K
  115. 0 MadhubaniBR 33% 397K
  116. 0 HapurUP 33% 102K
  117. 0 TiruchirappalliTN 32% 293K
  118. 0 BaksaAS 32% 149K
  119. 0 JalandharPB 32% 198K
  120. 0 MurshidabadWB 32% 705K
  121. 0 FaridabadHR 32% 120K
  122. 0 West GodavariAP 32% 134K
  123. 0 MuzaffarnagarUP 31% 180K
  124. 0 NuhHR 31% 107K
  125. 0 MirzapurUP 31% 267K
  126. 0 JalpaiguriWB 31% 286K
  127. 0 YamunanagarHR 31% 103K
  128. 0 KolkataWB 31% 56K
  129. 0 BhadrakOD 31% 122K
  130. 0 GurugramHR 31% 152K
  131. 0 BhiwaniHR 31% 144K
  132. 0 HooghlyWB 30% 439K
  133. 0 TinsukiaAS 30% 159K
  134. 0 GolaghatAS 30% 179K
  135. 0 BudgamJK 30% 126K
  136. 0 Udham Singh NagarUK 30% 142K
  137. 0 KishanganjBR 30% 183K
  138. 0 West SiangAR 30% 8K
  139. 0 SamastipurBR 30% 359K
  140. 0 BathindaPB 30% 184K
  141. 0 LucknowUP 30% 340K
  142. 0 GanganagarRJ 30% 291K
  143. 0 ArwalBR 30% 53K
  144. 0 ThanjavurTN 30% 244K
  145. 0 Fatehgarh SahibPB 30% 66K
  146. 0 BaramullaJK 30% 131K
  147. 0 ChanglangAR 30% 23K
  148. 0 MauUP 29% 187K
  149. 0 MogaPB 29% 119K
  150. 0 BudaunUP 29% 247K
  151. 0 Sri Muktsar SahibPB 29% 120K
  152. 0 AgraUP 29% 291K
  153. 0 PalwalHR 29% 89K
  154. 0 KargilLA 29% 20K
  155. 0 SonitpurAS 29% 161K
  156. 0 UnokotiTR 29% 33K
  157. 0 Paschim MedinipurWB 29% 370K
  158. 0 DhemajiAS 29% 92K
  159. 0 SuratGJ 29% 219K
  160. 0 BapatlaAP 28% 132K
  161. 0 East GodavariAP 28% 152K
  162. 0 GunturAP 28% 151K
  163. 0 LawngtlaiMZ 28% 12K
  164. 0 BharuchGJ 28% 134K
  165. 0 MahendragarhHR 28% 107K
  166. 0 LudhianaPB 28% 270K
  167. 0 GanderbalJK 28% 44K
  168. 0 CuddaloreTN 28% 231K
  169. 0 MathuraUP 28% 222K
  170. 0 JindHR 28% 114K
  171. 0 PrayagrajUP 28% 501K
  172. 0 EluruAP 27% 173K
  173. 0 HojaiAS 27% 92K
  174. 0 KonaseemaAP 27% 82K
  175. 0 BhandaraMH 27% 115K
  176. 0 JalgaonMH 27% 275K
  177. 0 HaridwarUK 27% 120K
  178. 0 SheoharBR 27% 46K
  179. 0 SitapurUP 27% 332K
  180. 0 FaridkotPB 26% 67K
  181. 0 Purba BardhamanWB 26% 401K
  182. 0 PuducherryPY 26% 59K
  183. 0 East ChamparanBR 26% 363K
  184. 0 GomatiTR 26% 60K
  185. 0 SiwanBR 26% 187K
  186. 0 AnjawAR 26% 2K
  187. 0 Lower SubansiriAR 26% 9K
  188. 0 AlappuzhaKL 26% 223K
  189. 0 PulwamaJK 25% 64K
  190. 0 KamleAR 25% 1K
  191. 0 KarurTN 25% 121K
  192. 0 AkolaMH 25% 116K
  193. 0 BijnorUP 25% 204K
  194. 0 VelloreTN 25% 113K
  195. 0 Papum PareAR 25% 24K
  196. 0 MungerBR 25% 74K
  197. 0 BiswanathAS 25% 61K
  198. 0 BaghpatUP 25% 80K
  199. 0 SaharanpurUP 25% 174K
  200. 0 GayaBR 24% 232K
  201. 0 East Garo HillsML 24% 24K
  202. 0 AurangabadBR 24% 132K
  203. 0 BhagalpurBR 24% 181K
  204. 0 MaharajganjUP 24% 162K
  205. 0 ChirangAS 24% 69K
  206. 0 BulandshahrUP 24% 219K
  207. 0 West ChamparanBR 24% 261K
  208. 0 ChennaiTN 24% 72K
  209. 0 NTRAP 24% 114K
  210. 0 MuzaffarpurBR 24% 315K
  211. 0 UjjainMP 24% 122K
  212. 0 SangrurPB 23% 138K
  213. 0 North Garo HillsML 23% 21K
  214. 0 BarmerRJ 23% 513K
  215. 0 SahibganjJH 23% 75K
  216. 0 SiangAR 23% 6K
  217. 0 North TripuraTR 23% 38K
  218. 0 BarnalaPB 23% 62K
  219. 0 KozhikodeKL 23% 237K
  220. 0 South Garo HillsML 23% 18K
  221. 0 MansaPB 23% 83K
  222. 0 AnantnagJK 23% 79K
  223. 0 West TripuraTR 22% 80K
  224. 0 Shahid Bhagat Singh NagarPB 22% 58K
  225. 0 Bhadradri KothagudemTG 22% 84K
  226. 0 KushinagarUP 22% 217K
  227. 0 PorbandarGJ 22% 54K
  228. 0 AligarhUP 22% 225K
  229. 0 BhojpurBR 22% 142K
  230. 0 KakinadaAP 22% 119K
  231. 0 UnnaoUP 22% 205K
  232. 0 MuluguTG 22% 24K
  233. 0 MungeliCG 22% 66K
  234. 0 KupwaraJK 22% 61K
  235. 0 Uttar DinajpurWB 22% 239K
  236. 0 ChandrapurMH 22% 162K
  237. 0 KotaRJ 22% 112K
  238. 0 JorhatAS 22% 88K
  239. 0 Lepa RadaAR 22% 3K
  240. 0 LehLA 21% 122K
  241. 0 PilibhitUP 21% 124K
  242. 0 AzamgarhUP 21% 313K
  243. 0 AmravatiMH 21% 184K
  244. 0 SiddharthnagarUP 21% 133K
  245. 0 PathankotPB 21% 44K
  246. 0 Dakshin DinajpurWB 21% 111K
  247. 0 ChuruRJ 21% 266K
  248. 0 ThaneMH 21% 146K
  249. 0 KasganjUP 21% 87K
  250. 0 ShahjahanpurUP 21% 167K
  251. 0 IndoreMP 21% 150K
  252. 0 KhowaiTR 21% 36K
  253. 0 ThiruvallurTN 21% 224K
  254. 0 YavatmalMH 21% 170K
  255. 0 PatanGJ 21% 106K
  256. 0 Pakke KessangAR 21% 3K
  257. 0 BoudhOD 20% 36K
  258. 0 BhadohiUP 20% 101K
  259. 0 BuldhanaMH 20% 162K
  260. 0 Karbi AnglongAS 20% 69K
  261. 0 West Garo HillsML 20% 49K
  262. 0 BalasoreOD 20% 128K
  263. 0 NagpurMH 20% 229K
  264. 0 RohtasBR 20% 129K
  265. 0 West Karbi AnglongAS 20% 31K
  266. 0 Uttara KannadaKA 20% 105K
  267. 0 Kanpur NagarUP 20% 164K
  268. 0 BotadGJ 20% 45K
  269. 0 FarrukhabadUP 20% 90K
  270. 0 ShajapurMP 19% 51K
  271. 0 MumbaiMH 19% 76K
  272. 0 BikanerRJ 19% 270K
  273. 0 JodhpurRJ 19% 390K
  274. 0 KannurKL 19% 187K
  275. 0 AlwarRJ 19% 284K
  276. 0 North SikkimSK 19% 6K
  277. 0 NawadaBR 19% 98K
  278. 0 BhindMP 19% 79K
  279. 0 BandaUP 19% 122K
  280. 0 LakshadweepLD 19% 2K
  281. 0 KottayamKL 19% 149K
  282. 0 BilaspurCG 19% 103K
  283. 0 HathrasUP 19% 77K
  284. 0 ChengalputtuTN 19% 89K
  285. 0 HamirpurUP 18% 70K
  286. 0 WardhaMH 18% 77K
  287. 0 SindhudurgMH 18% 67K
  288. 0 GopalganjBR 18% 126K
  289. 0 GwaliorMP 18% 86K
  290. 0 SipahijalaTR 18% 44K
  291. 0 MalappuramKL 18% 287K
  292. 0 GadchiroliMH 18% 79K
  293. 0 BirbhumWB 18% 248K
  294. 0 Imphal WestMN 18% 51K
  295. 0 ThoothukkudiTN 18% 126K
  296. 0 WashimMH 18% 63K
  297. 0 JajpurOD 18% 93K
  298. 0 ChitrakootUP 18% 65K
  299. 0 Lahaul and SpitiHP 18% 4K
  300. 0 Upper Dibang ValleyAR 18% 1K
  301. 0 ErnakulamKL 18% 228K
  302. 0 BemetaraCG 18% 42K
  303. 0 DimapurNL 18% 32K
  304. 0 RaigadMH 18% 154K
  305. 0 EtahUP 18% 94K
  306. 0 EtawahUP 18% 79K
  307. 0 BaranRJ 18% 76K
  308. 0 JabalpurMP 17% 116K
  309. 0 PuriOD 17% 74K
  310. 0 KaushambiUP 17% 111K
  311. 0 North GoaGA 17% 51K
  312. 0 TirupathurTN 17% 62K
  313. 0 BalrampurUP 17% 105K
  314. 0 PathanamthittaKL 17% 100K
  315. 0 Dakshina KannadaKA 17% 155K
  316. 0 ParbhaniMH 17% 85K
  317. 0 ShrawastiUP 17% 56K
  318. 0 JalaunUP 17% 88K
  319. 0 Lower SiangAR 17% 2K
  320. 0 Vav-TharadGJ 17% 106K
  321. 0 MorenaMP 17% 90K
  322. 0 SehoreMP 17% 77K
  323. 0 ChandelMN 17% 6K
  324. 0 Gir SomnathGJ 17% 84K
  325. 0 JaisalmerRJ 17% 99K
  326. 0 S.A.S. NagarPB 17% 54K
  327. 0 FirozabadUP 17% 105K
  328. 0 NoneyMN 17% 3K
  329. 0 JaunpurUP 17% 245K
  330. 0 DewasMP 17% 81K
  331. 0 JamnagarGJ 17% 93K
  332. 0 ThrissurKL 17% 206K
  333. 0 PrakasamAP 17% 99K
  334. 0 HardoiUP 17% 192K
  335. 0 AriyalurTN 17% 49K
  336. 0 NandedMH 17% 132K
  337. 0 Baloda BazarCG 17% 64K
  338. 0 BhopalMP 17% 84K
  339. 0 KakchingMN 17% 12K
  340. 0 BarabankiUP 16% 171K
  341. 0 NamakkalTN 16% 136K
  342. 0 DhuleMH 16% 96K
  343. 0 DurgCG 16% 81K
  344. 0 KasaragodKL 16% 81K
  345. 0 IdukkiKL 16% 65K
  346. 0 MehsanaGJ 16% 111K
  347. 0 VidishaMP 16% 72K
  348. 0 DhalaiTR 16% 32K
  349. 0 KangpokpiMN 16% 16K
  350. 0 KancheepuramTN 16% 143K
  351. 0 SurendranagarGJ 16% 95K
  352. 0 HoshangabadMP 16% 59K
  353. 0 South TripuraTR 16% 34K
  354. 0 VisakhapatnamAP 16% 55K
  355. 0 HoshiarpurPB 16% 96K
  356. 0 RaisenMP 16% 69K
  357. 0 SrikakulamAP 16% 86K
  358. 0 HyderabadTG 16% 57K
  359. 0 JunagadhGJ 16% 103K
  360. 0 PerambalurTN 16% 32K
  361. 0 UttarkashiUK 16% 23K
  362. 0 HingoliMH 16% 54K
  363. 0 RajkotGJ 15% 143K
  364. 0 RibhoiML 15% 21K
  365. 0 JhalawarRJ 15% 80K
  366. 0 NavsariGJ 15% 66K
  367. 0 Medchal–MalkajgiriTG 15% 103K
  368. 0 BhavnagarGJ 15% 126K
  369. 0 DatiaMP 15% 36K
  370. 0 ErodeTN 15% 165K
  371. 0 KolasibMZ 15% 5K
  372. 0 DholpurRJ 15% 50K
  373. 0 UdalguriAS 15% 60K
  374. 0 KhordhaOD 15% 101K
  375. 0 JhunjhunuRJ 15% 179K
  376. 0 NagaurRJ 15% 304K
  377. 0 NarsinghpurMP 15% 49K
  378. 0 UdupiKA 15% 74K
  379. 0 PalgharMH 15% 109K
  380. 0 KinnaurHP 15% 8K
  381. 0 RatnagiriMH 15% 99K
  382. 0 JaloreRJ 15% 155K
  383. 0 RajgarhMP 15% 71K
  384. 0 MorbiGJ 15% 63K
  385. 0 Kurung KumeyAR 14% 3K
  386. 0 BishnupurMN 14% 13K
  387. 0 Kanpur DehatUP 14% 74K
  388. 0 DamohMP 14% 59K
  389. 0 AmreliGJ 14% 100K
  390. 0 BanaskanthaGJ 14% 127K
  391. 0 RamanathapuramTN 14% 71K
  392. 0 TiruppurTN 14% 171K
  393. 0 KabirdhamCG 14% 48K
  394. 0 BageshwarUK 14% 15K
  395. 0 RatlamMP 14% 62K
  396. 0 TapiGJ 14% 43K
  397. 0 FatehpurUP 14% 109K
  398. 0 South West Garo HillsML 14% 13K
  399. 0 ChurachandpurMN 14% 12K
  400. 0 JalnaMH 14% 93K
  401. 0 Sarangarh BilaigarhCG 14% 27K
  402. 0 BalaghatMP 14% 97K
  403. 0 PalnaduAP 14% 78K
  404. 0 BurhanpurMP 14% 25K
  405. 0 Ambedkar NagarUP 13% 102K
  406. 0 MahePY 13% 2K
  407. 0 SheopurMP 13% 32K
  408. 0 Kumuram Bheem AsifabadTG 13% 27K
  409. 0 GajapatiOD 13% 23K
  410. 0 BundiRJ 13% 65K
  411. 0 LungleiMZ 13% 7K
  412. 0 AyodhyaUP 13% 107K
  413. 0 TamenglongMN 13% 6K
  414. 0 AuraiyaUP 13% 52K
  415. 0 MamitMZ 13% 5K
  416. 0 ViluppuramTN 13% 92K
  417. 0 Devbhumi DwarkaGJ 13% 48K
  418. 0 KulgamJK 13% 19K
  419. 0 SalemTN 13% 176K
  420. 0 PanchmahalGJ 13% 58K
  421. 0 RewaMP 13% 103K
  422. 0 KollamKL 13% 132K
  423. 0 GanjamOD 13% 107K
  424. 0 RaipurCG 13% 76K
  425. 0 Agar MalwaMP 13% 27K
  426. 0 ThoubalMN 13% 17K
  427. 0 VirudhunagarTN 13% 86K
  428. 0 AdilabadTG 13% 29K
  429. 0 KishtwarJK 13% 12K
  430. 0 South GoaGA 12% 25K
  431. 0 NandurbarMH 12% 59K
  432. 0 KulluHP 12% 27K
  433. 0 Janjgir-ChampaCG 12% 51K
  434. 0 CoimbatoreTN 12% 154K
  435. 0 AnakapalliAP 12% 66K
  436. 0 DhamtariCG 12% 36K
  437. 0 SukmaCG 12% 18K
  438. 0 KutchGJ 12% 133K
  439. 0 SultanpurUP 12% 95K
  440. 0 ThiruvananthapuramKL 12% 148K
  441. 0 BangaloreKA 12% 186K
  442. 0 MaduraiTN 12% 95K
  443. 0 Sawai MadhopurRJ 12% 65K
  444. 0 MainpuriUP 12% 68K
  445. 0 DharMP 12% 85K
  446. 0 MandlaMP 12% 53K
  447. 0 Chhatrapati SambhajinagarMH 12% 131K
  448. 0 SikarRJ 12% 172K
  449. 0 JammuJK 12% 69K
  450. 0 JhansiUP 12% 76K
  451. 0 BankuraWB 12% 145K
  452. 0 South AndamanAN 12% 9K
  453. 0 Kra DaadiAR 12% 1K
  454. 0 RupnagarPB 12% 32K
  455. 0 AravalliGJ 12% 40K
  456. 0 SabarkanthaGJ 12% 53K
  457. 0 TonkRJ 12% 71K
  458. 0 Daman, Diu & DNHDD 12% 16K
  459. 0 AshoknagarMP 11% 32K
  460. 0 MandsaurMP 11% 55K
  461. 0 East SinghbhumJH 11% 61K
  462. 0 DharmapuriTN 11% 73K
  463. 0 BijapurCG 11% 14K
  464. 0 HardaMP 11% 21K
  465. 0 BagalkotKA 11% 64K
  466. 0 ChamoliUK 11% 21K
  467. 0 PratapgarhUP 11% 145K
  468. 0 Upper SiangAR 11% 2K
  469. 0 YSR KadapaAP 11% 71K
  470. 0 SundargarhOD 11% 88K
  471. 0 DausaRJ 11% 73K
  472. 0 MuzaffarabadJK 11% 37K
  473. 0 Rae BareliUP 11% 93K
  474. 0 BankaBR 11% 74K
  475. 0 GunaMP 11% 42K
  476. 0 BalodCG 11% 34K
  477. 0 RambanJK 11% 11K
  478. 0 GadagKA 11% 27K
  479. 0 JaipurRJ 11% 253K
  480. 0 SaktiCG 11% 25K
  481. 0 KannaujUP 11% 48K
  482. 0 Paschim BardhamanWB 11% 82K
  483. 0 KhandwaMP 11% 44K
  484. 0 RayagadaOD 11% 27K
  485. 0 ValsadGJ 11% 54K
  486. 0 NeemuchMP 11% 34K
  487. 0 SolapurMH 11% 162K
  488. 0 JharsugudaOD 11% 21K
  489. 0 MahisagarGJ 11% 31K
  490. 0 AhilyanagarMH 10% 189K
  491. 0 NayagarhOD 10% 32K
  492. 0 Khairgarh Chhuikhadan GandaiCG 10% 17K
  493. 0 ChamarajanagarKA 10% 37K
  494. 0 RajnandgaonCG 10% 34K
  495. 0 RanipetTN 10% 47K
  496. 0 GondiaMH 10% 49K
  497. 0 NarmadaGJ 10% 21K
  498. 0 AmethiUP 10% 96K
  499. 0 KallakurichiTN 10% 41K
  500. 0 Ranga ReddyTG 10% 91K
  501. 0 Dima HasaoAS 10% 11K
  502. 0 AnantapuramuAP 10% 65K
  503. 0 NashikMH 10% 185K
  504. 0 AjmerRJ 10% 114K
  505. 0 DehradunUK 10% 52K
  506. 0 KhargoneMP 10% 62K
  507. 0 PannaMP 10% 38K
  508. 0 KrishnagiriTN 10% 69K
  509. 0 DarjeelingWB 10% 55K
  510. 0 SatnaMP 10% 73K
  511. 0 GarhwaJH 10% 38K
  512. 0 PalakkadKL 10% 106K
  513. 0 ChandigarhCH 10% 9K
  514. 0 KathuaJK 10% 29K
  515. 0 SagarMP 10% 65K
  516. 0 SerchhipMZ 10% 2K
  517. 0 Tehri GarhwalUK 9% 22K
  518. 0 MarkapuramAP 9% 32K
  519. 0 BeedMH 9% 90K
  520. 0 KarauliRJ 9% 52K
  521. 0 BellaryKA 9% 60K
  522. 0 NandyalAP 9% 41K
  523. 0 ChittorgarhRJ 9% 63K
  524. 0 SirmaurHP 9% 19K
  525. 0 DharwadKA 9% 40K
  526. 0 The NilgirisTN 9% 21K
  527. 0 HanumakondaTG 9% 24K
  528. 0 PithoragarhUK 9% 17K
  529. 0 Parvathipuram ManyamAP 9% 19K
  530. 0 SangliMH 9% 92K
  531. 0 Chhota UdaipurGJ 9% 30K
  532. 0 PherzawlMN 9% 1K
  533. 0 KodaguKA 9% 24K
  534. 0 Alluri Sitharama RajuAP 9% 20K
  535. 0 Pauri GarhwalUK 9% 27K
  536. 0 TirunelveliTN 9% 56K
  537. 0 DindigulTN 9% 78K
  538. 0 SonbhadraUP 9% 59K
  539. 0 ShivpuriMP 9% 60K
  540. 0 East SiangAR 9% 5K
  541. 0 TirupatiAP 9% 63K
  542. 0 PaliRJ 9% 86K
  543. 0 UmariaMP 9% 21K
  544. 0 WayanadKL 9% 30K
  545. 0 KoppalKA 9% 36K
  546. 0 NelloreAP 9% 81K
  547. 0 NarayanpurCG 9% 4K
  548. 0 MancherialTG 9% 24K
  549. 0 Mohla Manpur Ambagarh ChoukiCG 9% 11K
  550. 0 SenapatiMN 9% 6K
  551. 0 LaturMH 8% 61K
  552. 0 BijapurKA 8% 60K
  553. 0 AngulOD 8% 48K
  554. 0 PanchkulaHR 8% 13K
  555. 0 PalamuJH 8% 44K
  556. 0 LohitAR 8% 2K
  557. 0 YadgirKA 8% 26K
  558. 0 KandhamalOD 8% 23K
  559. 0 BhilwaraRJ 8% 93K
  560. 0 NainitalUK 8% 27K
  561. 0 JhargramWB 8% 27K
  562. 0 BelgaumKA 8% 123K
  563. 0 TiruvannamalaiTN 8% 79K
  564. 0 KarimnagarTG 8% 28K
  565. 0 MandiHP 8% 44K
  566. 0 TawangAR 8% 3K
  567. 0 Lower Dibang ValleyAR 8% 3K
  568. 0 KanniyakumariTN 8% 46K
  569. 0 PratapgarhRJ 8% 31K
  570. 0 JamuiBR 8% 37K
  571. 0 West Khasi HillsML 8% 12K
  572. 0 RaichurKA 8% 45K
  573. 0 PuneMH 8% 187K
  574. 0 MahobaUP 8% 26K
  575. 0 SeoniMP 8% 38K
  576. 0 KatniMP 8% 35K
  577. 0 Bangalore RuralKA 8% 36K
  578. 0 ChhindwaraMP 8% 61K
  579. 0 BetulMP 8% 48K
  580. 0 PakurJH 8% 22K
  581. 0 KurnoolAP 8% 39K
  582. 0 WarangalTG 8% 20K
  583. 0 SubarnapurOD 8% 16K
  584. 0 GariyabandCG 8% 19K
  585. 0 SambaJK 8% 14K
  586. 0 SidhiMP 8% 32K
  587. 0 GulbargaKA 8% 51K
  588. 0 Jogulamba GadwalTG 8% 14K
  589. 0 KalahandiOD 8% 38K
  590. 0 ChittoorAP 8% 43K
  591. 0 Yadadri BhuvanagiriTG 8% 22K
  592. 0 MalkangiriOD 8% 20K
  593. 0 TheniTN 7% 28K
  594. 0 NalgondaTG 7% 38K
  595. 0 DeogarhOD 7% 11K
  596. 0 UdaipurRJ 7% 93K
  597. 0 ChampawatUK 7% 7K
  598. 0 SivagangaTN 7% 43K
  599. 0 SangareddyTG 7% 35K
  600. 0 SirohiRJ 7% 32K
  601. 0 PeddapalliTG 7% 19K
  602. 0 RaigarhCG 7% 28K
  603. 0 LalitpurUP 7% 32K
  604. 0 SingrauliMP 7% 33K
  605. 0 KankerCG 7% 24K
  606. 0 RudraprayagUK 7% 7K
  607. 0 BarwaniMP 7% 34K
  608. 0 Saraikela-KharsawanJH 7% 26K
  609. 0 East Khasi HillsML 7% 22K
  610. 0 TenkasiTN 7% 38K
  611. 0 Jayashankar BhupalpallyTG 7% 11K
  612. 0 SataraMH 7% 75K
  613. 0 ChambaHP 7% 15K
  614. 0 East SikkimSK 7% 8K
  615. 0 ChhatarpurMP 7% 49K
  616. 0 TengnoupalMN 7% 1K
  617. 0 MokokchungNL 7% 5K
  618. 0 KoraputOD 7% 30K
  619. 0 PunchJK 7% 46K
  620. 0 BanswaraRJ 7% 43K
  621. 0 AlmoraUK 7% 18K
  622. 0 Rajanna SircillaTG 7% 13K
  623. 0 BastarCG 7% 19K
  624. 0 RajouriJK 7% 21K
  625. 0 DodaJK 7% 9K
  626. 0 RamanagaraKA 7% 27K
  627. 0 NuapadaOD 7% 16K
  628. 0 DindoriMP 7% 20K
  629. 0 MirpurJK 6% 36K
  630. 0 WokhaNL 6% 3K
  631. 0 NirmalTG 6% 14K
  632. 0 DharashivMH 6% 39K
  633. 0 KendujharOD 6% 45K
  634. 0 ReasiJK 6% 10K
  635. 0 BidarKA 6% 28K
  636. 0 DangGJ 6% 6K
  637. 0 RajsamandRJ 6% 36K
  638. 0 MahabubnagarTG 6% 15K
  639. 0 BalangirOD 6% 35K
  640. 0 LongdingAR 6% 2K
  641. 0 DantewadaCG 6% 8K
  642. 0 JagtialTG 6% 22K
  643. 0 SambalpurOD 6% 23K
  644. 0 DahodGJ 6% 31K
  645. 0 West SinghbhumJH 6% 31K
  646. 0 KangraHP 6% 44K
  647. 0 AnnamayyaAP 6% 25K
  648. 0 VizianagaramAP 6% 26K
  649. 0 ShimlaHP 6% 22K
  650. 0 South SikkimSK 6% 6K
  651. 0 UkhrulMN 6% 4K
  652. 0 UnaHP 6% 15K
  653. 0 NicobarsAN 6% 1K
  654. 0 MysoreKA 6% 48K
  655. 0 ChitradurgaKA 6% 30K
  656. 0 KolarKA 6% 29K
  657. 0 SuryapetTG 6% 19K
  658. 0 NiwariMP 6% 10K
  659. 0 MonNL 6% 6K
  660. 0 KorbaCG 5% 26K
  661. 0 AlirajpurMP 5% 17K
  662. 0 JhabuaMP 5% 23K
  663. 0 GoddaJH 5% 25K
  664. 0 East Jaintia HillsML 5% 5K
  665. 0 ShimogaKA 5% 36K
  666. 0 JangaonTG 5% 10K
  667. 0 PudukkottaiTN 5% 38K
  668. 0 KhammamTG 5% 25K
  669. 0 ShahdolMP 5% 26K
  670. 0 ChatraJH 5% 18K
  671. 0 South West Khasi HillsML 5% 3K
  672. 0 Sri Sathya SaiAP 5% 29K
  673. 0 NarayanpetTG 5% 8K
  674. 0 ShopiyanJK 5% 6K
  675. 0 BilaspurHP 5% 10K
  676. 0 KolhapurMH 5% 53K
  677. 0 BalrampurCG 5% 15K
  678. 0 KondagaonCG 5% 13K
  679. 0 KhawzawlMZ 5% 2K
  680. 0 TikamgarhMP 5% 21K
  681. 0 NizamabadTG 5% 19K
  682. 0 DungarpurRJ 5% 25K
  683. 0 SiddipetTG 5% 16K
  684. 0 TumkurKA 4% 46K
  685. 0 BargarhOD 4% 21K
  686. 0 West SikkimSK 4% 4K
  687. 0 AnuppurMP 4% 15K
  688. 0 ChamphaiMZ 4% 1K
  689. 0 ChikkaballapuraKA 4% 20K
  690. 0 ChikmagalurKA 4% 20K
  691. 0 UdhampurJK 4% 11K
  692. 0 VikarabadTG 4% 11K
  693. 0 WanaparthyTG 4% 7K
  694. 0 DhenkanalOD 4% 18K
  695. 0 SolanHP 4% 10K
  696. 0 RanchiJH 4% 39K
  697. 0 DhanbadJH 4% 28K
  698. 0 RamgarhJH 4% 13K
  699. 0 TirapAR 4% 1K
  700. 0 SaihaMZ 4% 1K
  701. 0 HaveriKA 4% 20K
  702. 0 NagarkurnoolTG 4% 11K
  703. 0 KodermaJH 4% 8K
  704. 0 PhekNL 4% 2K
  705. 0 Manendragarh Chirimiri BharatpurCG 4% 7K
  706. 0 DavanagereKA 4% 21K
  707. 0 MahasamundCG 4% 14K
  708. 0 SurajpurCG 4% 12K
  709. 0 BokaroJH 4% 24K
  710. 0 MayurbhanjOD 4% 34K
  711. 0 LateharJH 4% 10K
  712. 0 LonglengNL 4% 1K
  713. 0 HamirpurHP 4% 9K
  714. 0 HazaribaghJH 4% 18K
  715. 0 MandyaKA 3% 20K
  716. 0 KamareddyTG 3% 9K
  717. 0 NabarangapurOD 3% 17K
  718. 0 HnahthialMZ 3% 0K
  719. 0 HassanKA 3% 22K
  720. 0 JashpurCG 3% 11K
  721. 0 West Jaintia HillsML 3% 5K
  722. 0 DeogharJH 3% 17K
  723. 0 TuensangNL 3% 2K
  724. 0 SurgujaCG 3% 10K
  725. 0 KalimpongWB 3% 4K
  726. 0 Gaurella Pendra MarwahiCG 3% 5K
  727. 0 AizawlMZ 3% 4K
  728. 0 SimdegaJH 3% 7K
  729. 0 LohardagaJH 3% 4K
  730. 0 KiphireNL 3% 1K
  731. 0 PerenNL 3% 1K
  732. 0 MahabubabadTG 3% 7K
  733. 0 KoreaCG 3% 2K
  734. 0 DumkaJH 2% 13K
  735. 0 GumlaJH 2% 9K
  736. 0 MedakTG 2% 5K
  737. 0 GiridihJH 2% 13K
  738. 0 ZunhebotoNL 2% 1K
  739. 0 PuruliaWB 2% 16K
  740. 0 KhuntiJH 2% 3K
  741. 0 KohimaNL 2% 1K
  742. 0 KamjongMN 1% 0K
  743. 0 JamtaraJH 1% 2K

The severe (> 3 m) tail concentrates in the incised Godavari gorge (Andhra's Polavaram, Telangana's Bhadradri Kothagudem) and Kerala's hill-edge districts (Idukki, Pathanamthitta, Kannur) — partly genuine steep-valley flooding, partly where the DEM is weakest. We flag it rather than hide it.

How it's built

From raw satellite terrain to a modeled flood — in four stages.

A fully documented pipeline. Click a stage to see what happens inside.

Stage 1

A high-accuracy bare-earth terrain model

The NEER DEM is a bare-earth terrain model built for hydrology across India. We derive it from GEDTM30 (CC-BY, OpenGeoHub) and calibrate it against ICESat-2 ATL08 ground photons — NASA laser measurements of the true ground surface. A spatially-blocked, cross-validated bias surface removes systematic error, and a LightGBM residual model corrects what remains. Heights are referenced to the EGM2008 geoid and hydro-flattened (sea → 0, inland water → bank level) so water routes correctly through the model.

Raw GEDTM30 (runs high) NEER DEM · matches ground truth ●

Stage 2

Rainfall → runoff (SCS-CN)

Rainfall losses — how much soaks in versus runs off — are set by the SCS Curve Number method, varied across the grid by land cover and soil. These losses are computed inside the 2D model itself, not as a separate step.

Stage 3

The 1% (100-year) design storm

Statistical frequency analysis of rainfall records yields the 1% annual-chance design rainfall — the event that defines this flood layer.

Stage 4

Rain-on-grid 2D modeling

We model the flood as a rain-on-grid (direct-rainfall) 2D HEC-RAS simulation: the design rainfall falls directly onto the terrain mesh and runs as unsteady flow over the NEER DEM, with Curve-Number losses applied cell by cell. Hydrology (rainfall → runoff) and hydraulics (how water moves and pools) are solved together in one model — with no separate hydrologic model or gauged inflow hydrographs. That is what lets it run consistently across India’s largely ungauged basins.

Modeled flood depth · HEC-RAS 2D

Accuracy & limitations

We measured it against the ground. Here's the honest result.

1.68 m 1.47 m

National terrain error (MAE), before → after correction

≈ 0.01 m

Systematic bias, driven to near-zero nationwide

Terrain accuracy by state (MAE vs ICESat-2)

  • Delhi 0.59 m
  • Haryana 0.61 m
  • Punjab 0.65 m
  • Rajasthan 0.69 m
  • Bihar 0.72 m
  • Tamil Nadu 1.04 m
  • Kerala 1.65 m

In the atlas states the NEER DEM is at its strongest. Tamil Nadu lands at 1.04 m and Kerala at 1.65 m mean absolute error against ICESat-2, at near-zero bias — flat, flood-relevant terrain, which is exactly where terrain accuracy matters most for modeled flood depth. Accuracy is lower in steep, mountainous regions, where even the satellite ground-truth is itself noisy.

What this map can't tell you

  • These are modeled flood depths, not observed flood records. They show where a 1% annual-chance event would likely produce flooding — not a forecast or a guarantee.
  • ~30 m resolution. This is regional hazard screening, not parcel-level or street-level certainty.
  • Terrain accuracy is lower in steep and mountainous areas; some locations are still rough. The atlas leads with flat, flood-relevant terrain where the DEM is strongest.
  • Hydraulic models can produce artifacts. We null physically implausible depths (we removed modeled depths over 100 m), but residual local errors can remain.

Coverage

Live today. Every state and union territory.

Live

Tamil Nadu

Hover a state to highlight it; click a live state to open its map. The data is published on a schema built to grow — every new return period and climate scenario drops straight in.

Return periods

2-yr 50% / yr On request
5-yr 20% / yr On request
10-yr 10% / yr On request
25-yr 4% / yr On request
50-yr 2% / yr On request
100-yr 1% / yr Free · Live
500-yr 0.2% / yr On request
1000-yr 0.1% / yr On request

Only the 100-year (1%) event is free today. The others — and full property-level risk — are available from NEER on request.
Request other return periods ↗

Climate scenarios

Current climate Today’s rainfall baseline Free · Live
2100 · future climate SSP2-4.5 & SSP5-8.5 pathways On request

We also model the 2100 flood under future-climate rainfall — IDF design storms shifted along SSP warming pathways — to show how the 1% event grows. Available on request.

Live now
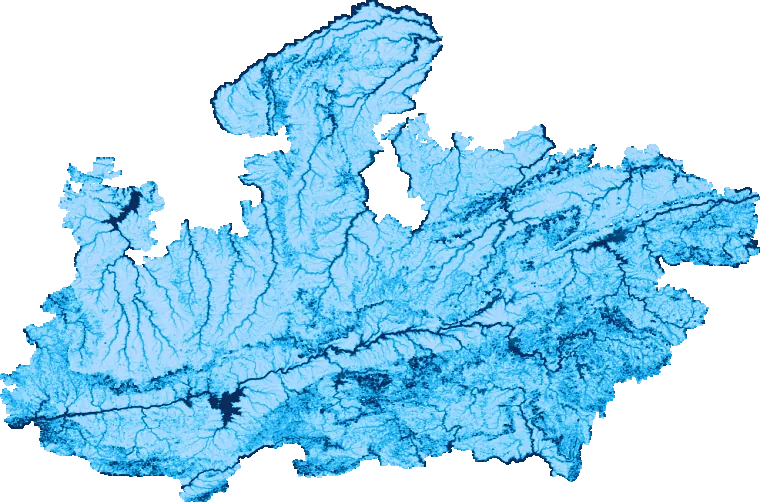
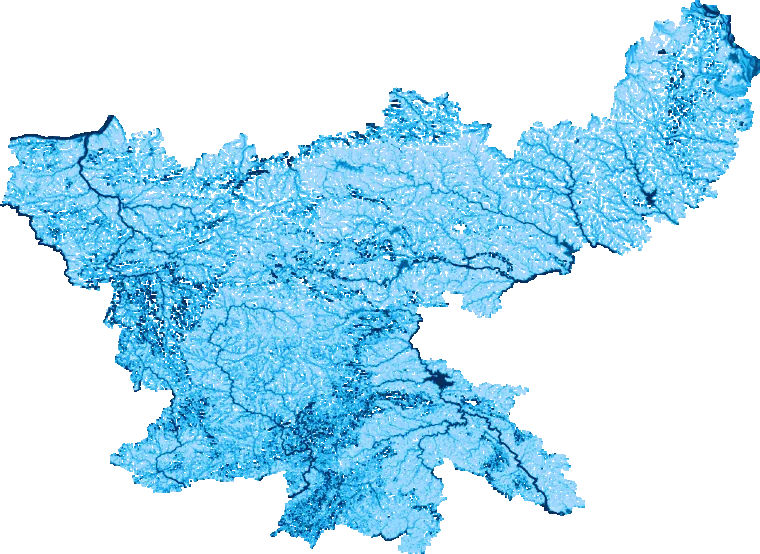
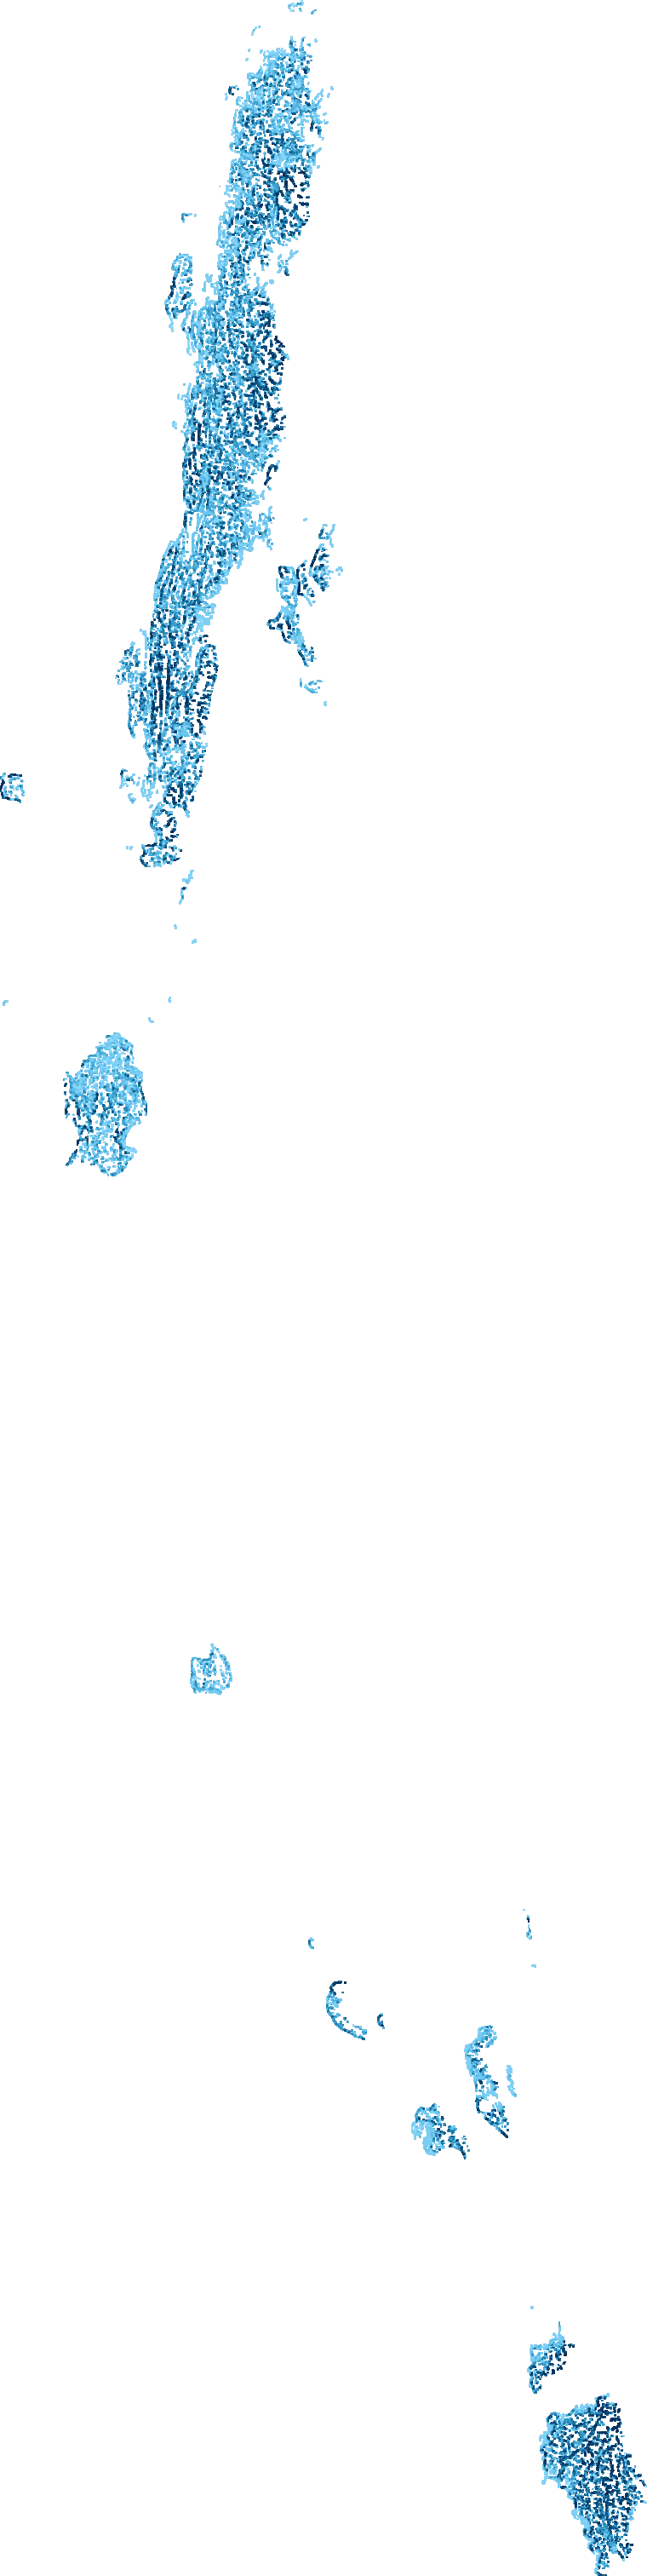
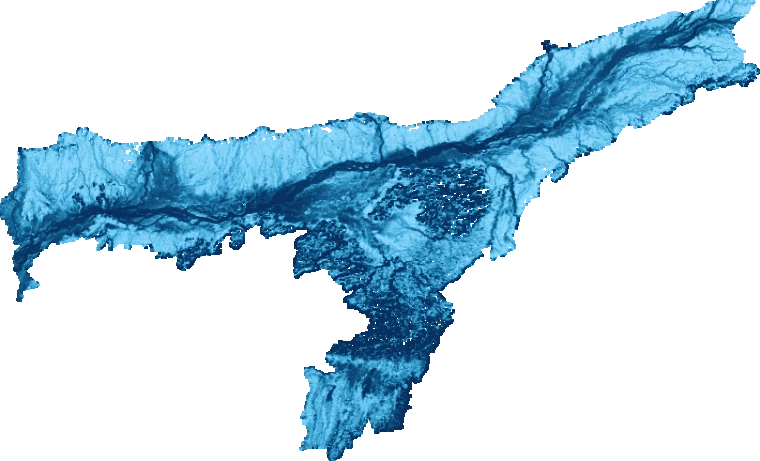
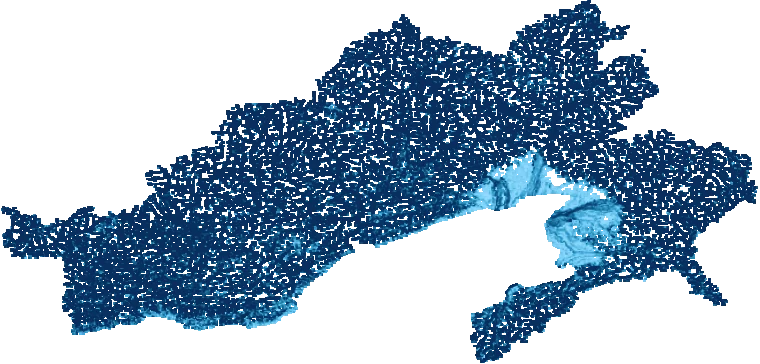
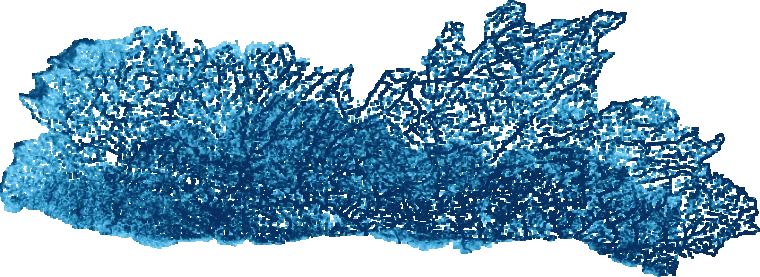
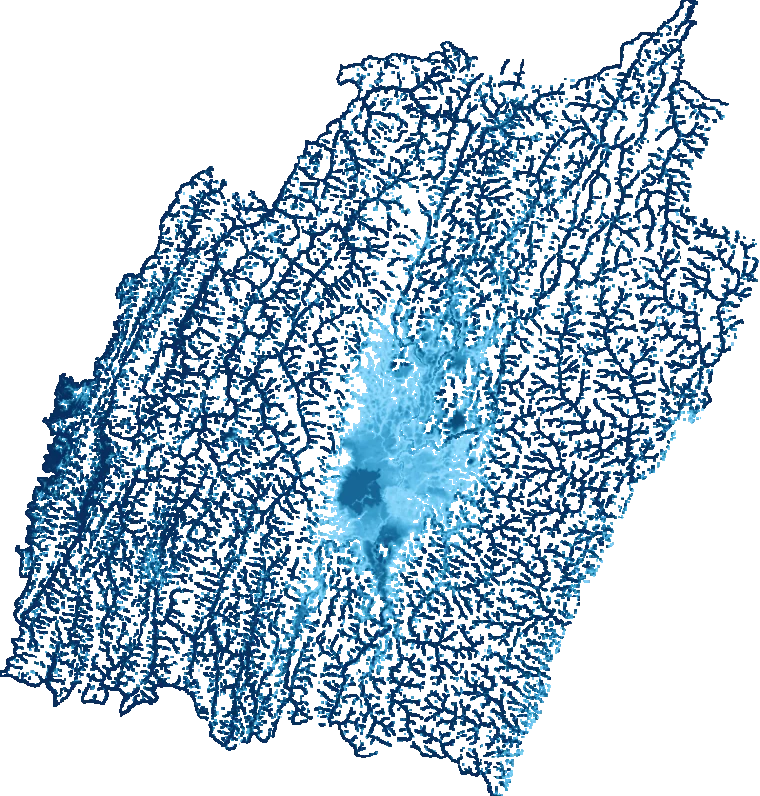
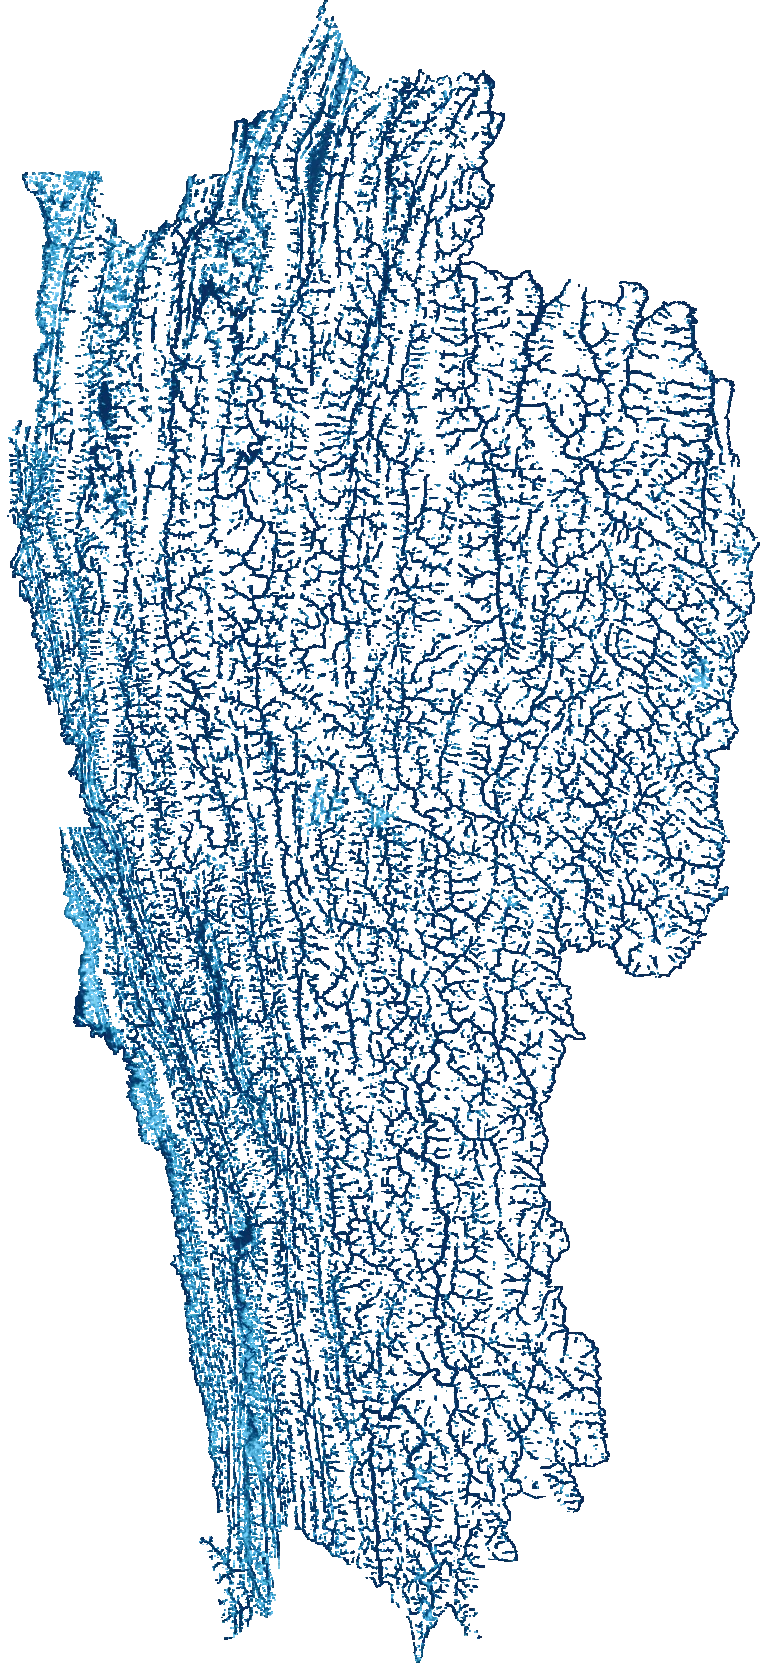
Tamil Nadu & PuducherryKeralaKarnatakaGoaAndhra PradeshTelanganaMaharashtraOdishaChhattisgarhGujaratRajasthanHaryanaPunjabChandigarhJammu & KashmirDaman, Diu & DNHLadakhDelhiHimachal PradeshUttarakhandUttar PradeshWest BengalSikkimBiharMadhya PradeshJharkhandAndaman & Nicobar IslandsLakshadweepAssamArunachal PradeshMeghalayaManipurMizoramNagalandTripura

Puducherry is in every statistic; its enclaves (Karaikal, Puducherry, Mahe) are too small to draw on the map.

Data access · for teams

Need flood data at scale? Tap the API.

The map is free for everyone. For organizations, we serve the underlying data for any area of interest — a city, a district, an asset portfolio, or a whole state — through a simple API.

  • Building, road & rail exposure, summarized for your area of interest
  • An embeddable map-tile layer for property portals — plus the 0–100 NEER Flood Score
  • Per-property flood reports (PDF) — the NEER Flood Score, depth and a flood map
  • Return periods from 2-year to 1000-year, delivered as JSON, CSV or tiles

Built for governments, insurers, proptech, infrastructure planners and researchers.

flood-atlas · exposure API
# exposure for any area of interest
curl https://flood-api.neer.io/exposure \
     ?region=tamil_nadu &event=100yr

{
  "event": "100yr", "unit": "meters",
  "buildings": { "total": 25231607, "exposed": 4060006, "pct": 16.1 },
  "roads_km":  { "total": 419015, "at_risk": 81574, "pct": 19.5 },
  "rail_km":   { "total": 8335, "at_risk": 2456, "pct": 29.5 },
  "depth_cog": "https://.../100yr/tamil_nadu.tif"
}

See the flood map for your state.

Free to explore. No login. Opens the live interactive map.

Need other return periods (2-yr to 1000-yr) or full property-level risk? Contact NEER →

Questions

Frequently asked

What does “1% annual-chance” or “100-year flood” actually mean?

It means a flood of this size has a 1% chance of happening in any given year — every year. It is NOT “once every 100 years.” Over a 30-year mortgage, the chance of seeing at least one such flood is about 26%. The name is a probability, not a schedule.

How do I find my home on the map?

Open the map and type your address into the search bar — it will zoom straight to that spot. If your exact address doesn’t come up, search a nearby landmark or locality instead, then pan and zoom in until you find your building. The blue shading is the modeled 100-year flood; if it covers your rooftop, your building sits inside the floodplain. Click any point to read the modeled flood depth there — how much water that spot would see in a 1% (100-year) event. It’s ~30 m data, so read it as “this building/area could flood,” not an exact figure for one wall.

What do the colours on the map mean?

The colour shows how deep the water gets. Lighter blue is shallower water; deeper, darker blue means deeper — and more dangerous — flooding. Anywhere shaded is expected to take on some water in a 1% (100-year) event; the shade tells you roughly how much. Click a point on the map for the exact modeled depth there.

ShallowDeep
Is this an official government flood map?

No. It is an open, independent, modeled flood hazard atlas built by NEER for public awareness and planning context. Always defer to official local authorities for regulatory or emergency decisions.

How accurate is it?

The underlying NEER DEM reaches sub-meter to ~1.6 m accuracy in the atlas states (Tamil Nadu 1.04 m, Kerala 1.65 m corrected MAE vs ICESat-2), at near-zero bias. The flood layer is modeled on top of that at ~30 m, so treat it as regional hazard screening rather than parcel-level truth.

The map shows my area flooding, but I've never seen it flood. Why?

Three reasons, usually. First, this is the 1% (100-year) event — a rare, severe flood. You can live somewhere for decades and never witness it, and that does not mean the risk is zero. Second, the map shows modeled hazard — where water would go in that extreme event — not a record of floods that have already happened. Third, at ~30 m resolution it cannot see every wall, embankment, or drain that might protect a specific building. Read it as “this area could flood in a severe event,” not “this will flood.”

My area floods often, but the map doesn't show it. Why?

This layer models one specific thing: the 1% annual-chance river and rainfall flood. It does not capture chronic, local flooding from blocked drains, overwhelmed urban stormwater, very localized low spots, or small channels below the ~30 m grid. Frequent street flooding from poor drainage is real — it is simply a different problem than the large, rare event this map is built to show. That gap is exactly why we publish our limitations alongside the map rather than hide them.

I'm in the 100-year floodplain — what should I do?

Plan, don’t panic — this is a hazard screen, not a prediction that your home will flood. A few sensible steps: (1) Confirm locally — at ~30 m the map can’t see your exact plot, which may sit higher or lower, so check with local authorities and your own experience. (2) Be ready — know your nearest higher ground and route to it, sign up for any local flood warnings, and keep documents, medicines and an emergency kit handy. (3) Protect the building — where you can, raise electrical points and valuables above likely water levels, keep nearby drains and channels clear, and consider barriers or seals for doors and openings. (4) Building or buying? Factor it in — a higher plinth and good site drainage go a long way. (5) Look into home insurance — India has no standalone flood policy, but standard home cover (like IRDAI’s Bharat Griha Raksha) already includes flood damage under “STFI” perils. Very few households carry any cover, so it’s worth knowing the option exists.

A flood is happening right now — what do I do?
If water is rising and life is at risk, get to higher ground immediately — do not wait.
  • Move up and out. Head to the highest safe ground or upper floor you can reach. Leave early; don’t wait to see how bad it gets.
  • Never enter floodwater. Don’t walk, swim or drive through it. Just 15 cm (6 in) of moving water can knock you off your feet; 30 cm (2 ft) can sweep away a car. If you can’t see the road, turn around.
  • Beware electricity. Stay away from fallen power lines, electric poles and submerged outlets — electrocution is a real flood danger. Switch off mains power if you can do so safely.
  • Keep clear of drains, canals and rivers. Currents and open drains are hidden killers during floods.
  • Trapped indoors? Go to the highest floor and signal for help. Move onto the roof only if water keeps rising — don’t shut yourself in a windowless top room.
  • Follow the authorities. Obey evacuation orders and official alerts.

Emergency numbers (India): 112 — all-India emergency · 108 — ambulance · 1077 — district disaster control room.

What can actually be done to reduce flood risk?

It spans scales, and it’s mostly about planning ahead. City and regional level: keep new development out of the highest-hazard zones, protect and restore natural drainage (wetlands, floodplains, lakes, urban green space that soak up water), and invest in stormwater drainage, embankments and early-warning systems where they matter most. Building level: elevated plinths, flood-resilient materials, protected utilities. None of it is quick or cheap — chronic urban flooding often needs sustained drainage investment — which is exactly why knowing where the risk concentrates matters: it lets planners aim limited budgets at the places and people most exposed. That prioritization is what this atlas is built to support.

Is it free? Can I use it?

Yes — it is free and public. The methodology and source data are documented and openly licensed (see attributions). Get in touch if you want to collaborate or need the underlying data.

Which states and return periods are available?

Free today: the 100-year (1% annual chance) flood layer now spans all 36 states and union territories — the whole Indo-Gangetic plain (Uttar Pradesh, Bihar, West Bengal, Punjab, Haryana, Delhi), the west (Rajasthan, Gujarat, Madhya Pradesh), the Himalaya (Jammu & Kashmir, Ladakh, Himachal Pradesh, Uttarakhand, Sikkim), the east (Jharkhand, Odisha, Chhattisgarh), the Northeast (Assam, Arunachal Pradesh, Meghalaya, Manipur, Mizoram, Nagaland, Tripura) and the south (Tamil Nadu, Andhra Pradesh, Telangana, Karnataka, Kerala, Goa) plus the islands (Andaman & Nicobar, Lakshadweep), Puducherry, Chandigarh and Daman, Diu & DNH. Interactive maps are live for the southern and central states; the newest additions show data and analysis now with maps following. Other return periods — 2, 5, 10, 25, 50, 500 and 1000-year — and full property-level risk are available from NEER on request.